Century 21 People’s Choice Realty Inc., Brokerage
120 MATHESON BLVD E #103
MISSISSAUGA, Ontario
L4Z 1X1


Ottawa, Courtland Park, K2C 1R1
$1,180,000$000000
Listed by RE/MAX HALLMARK REALTY GROUP.
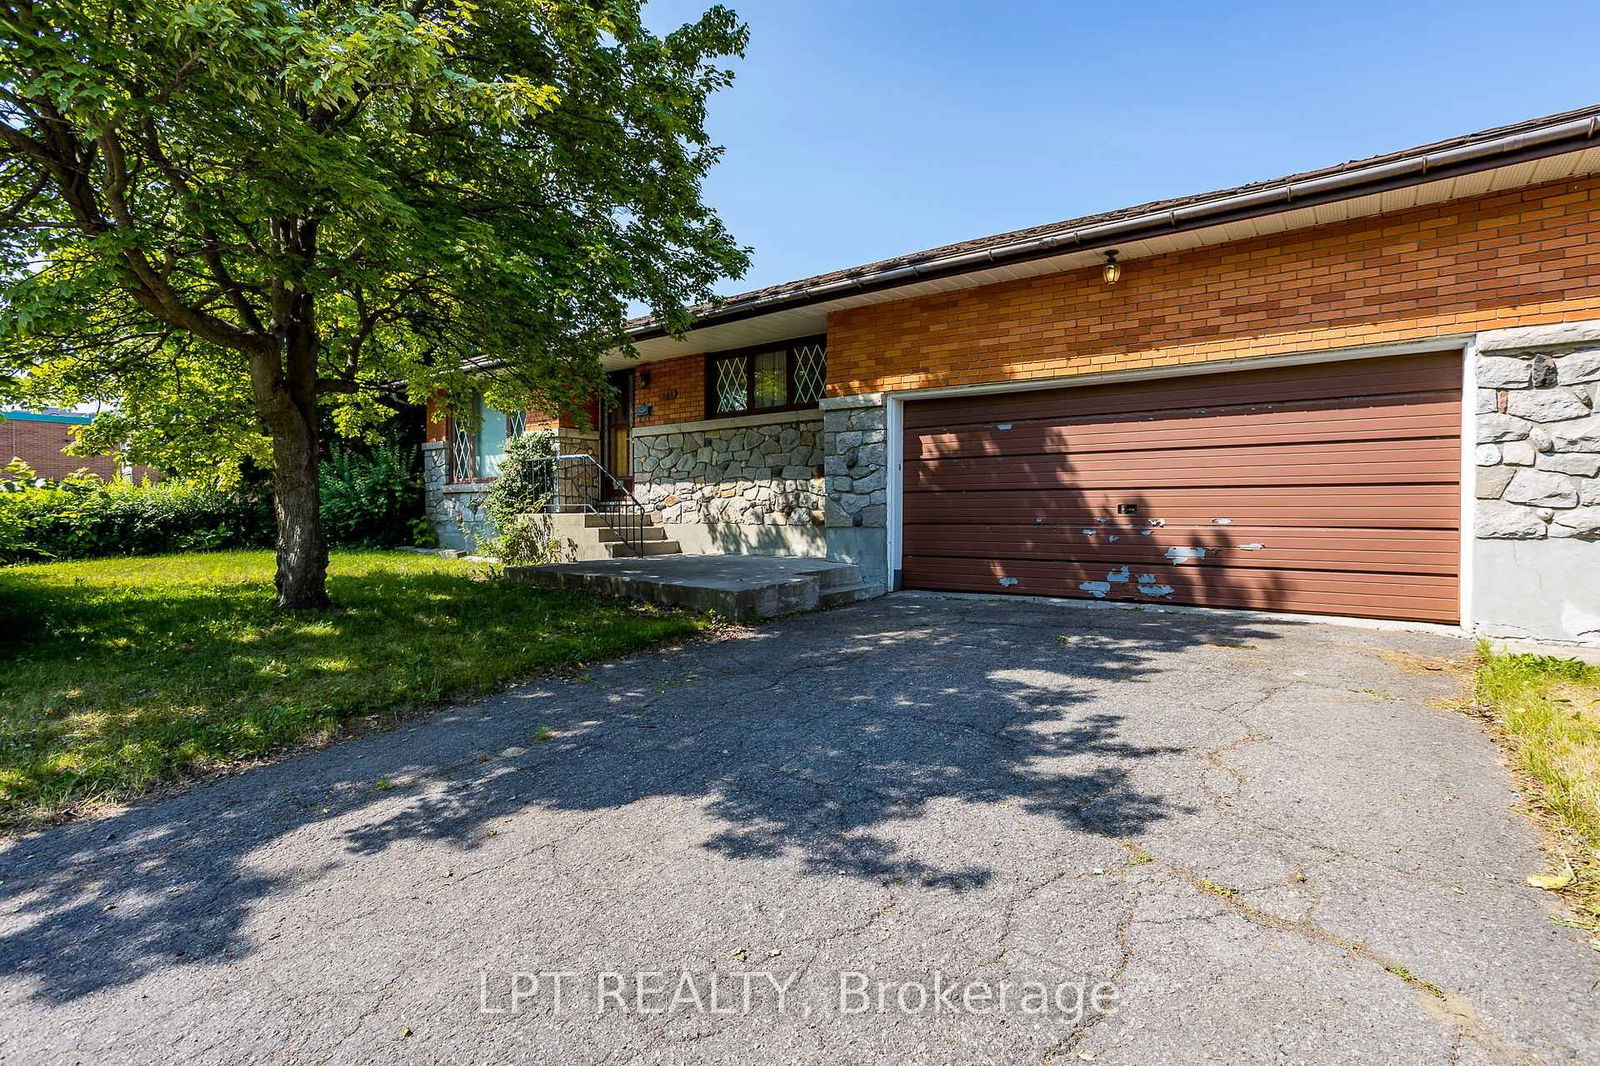
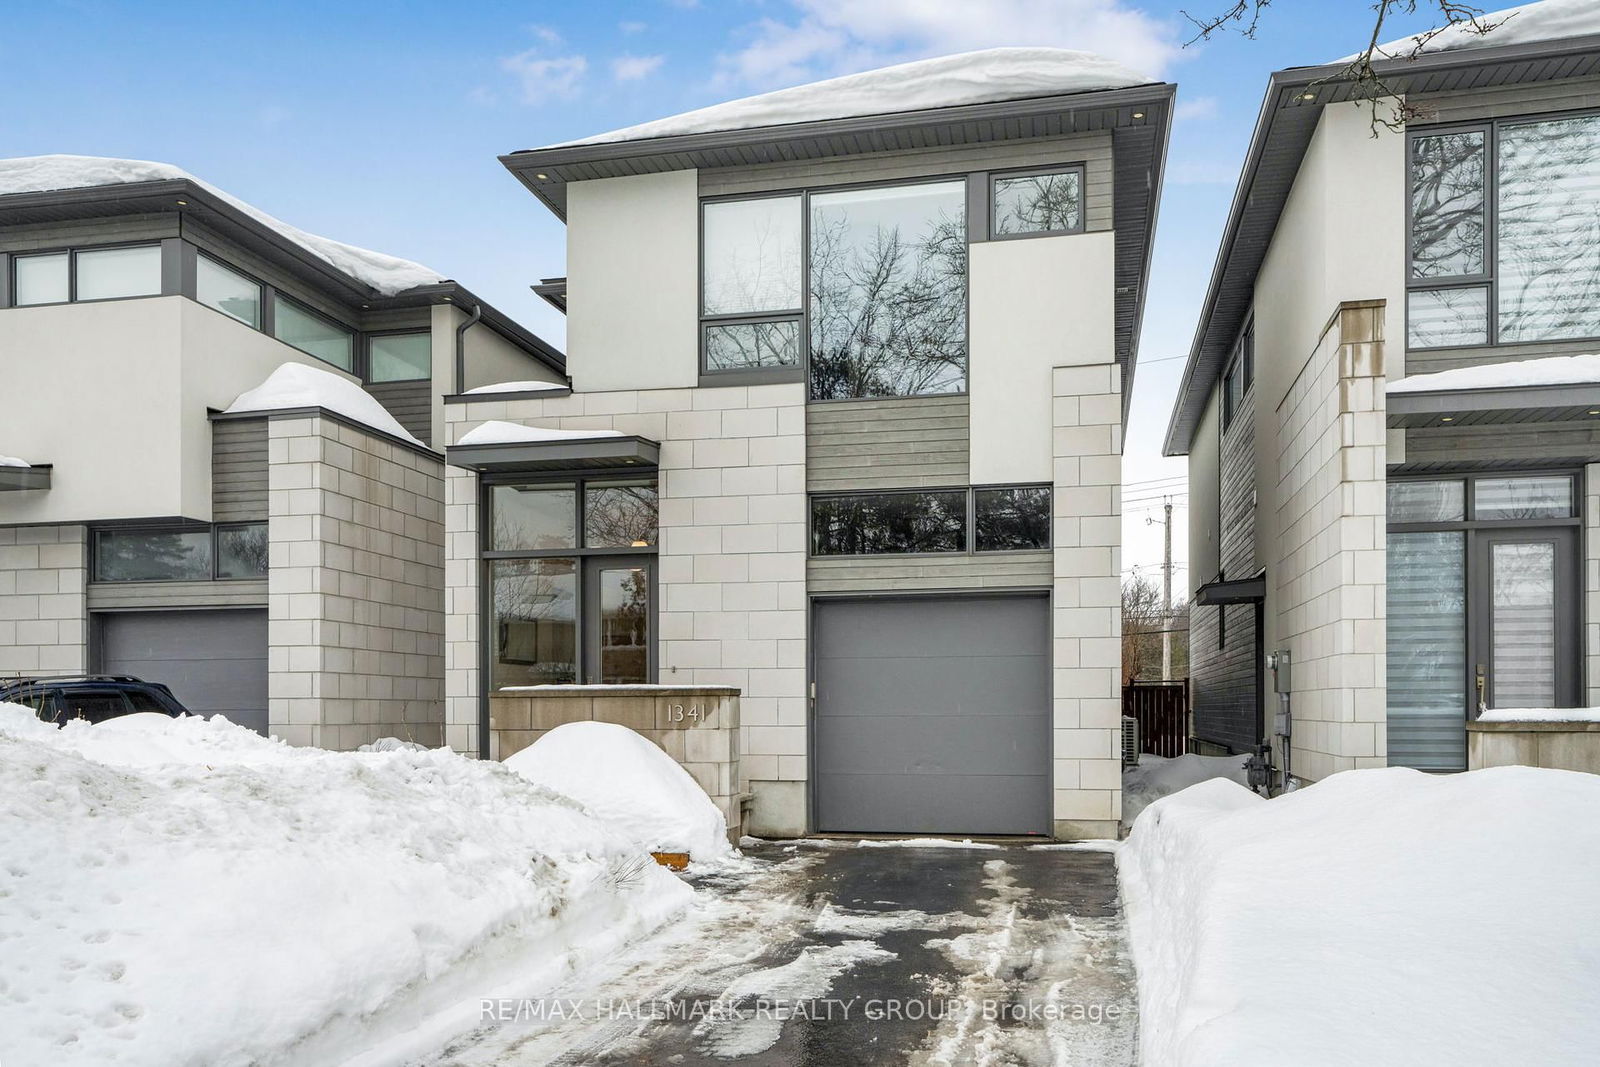
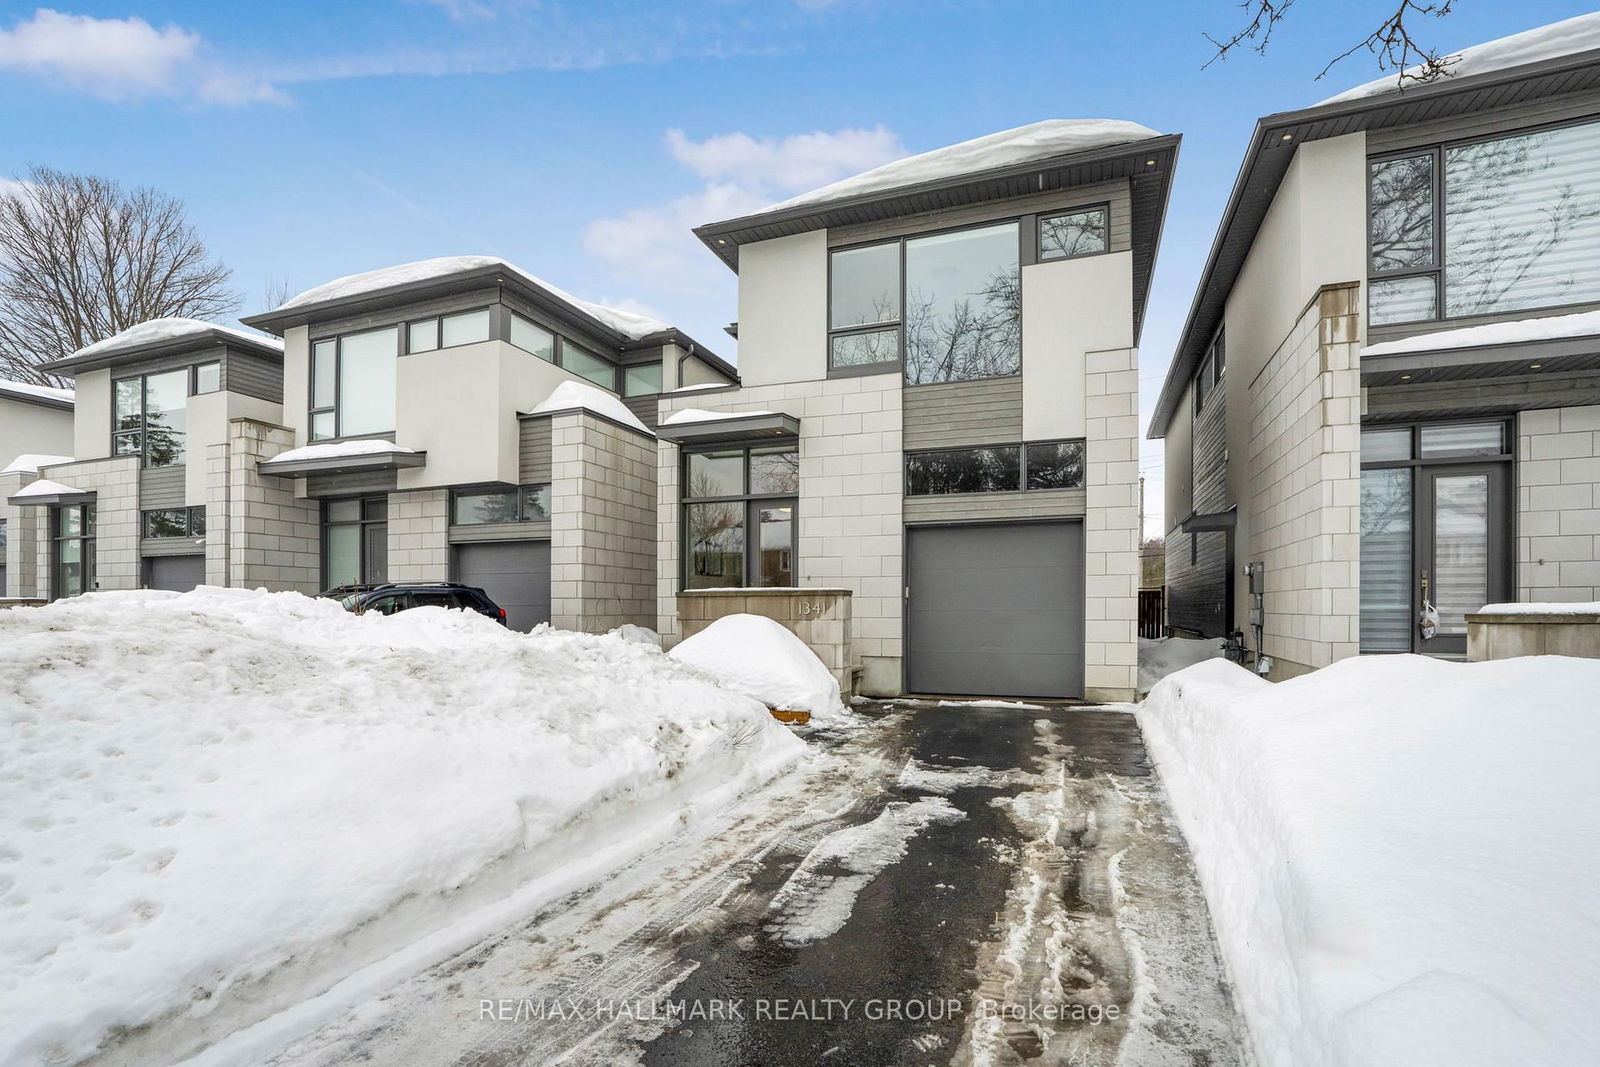
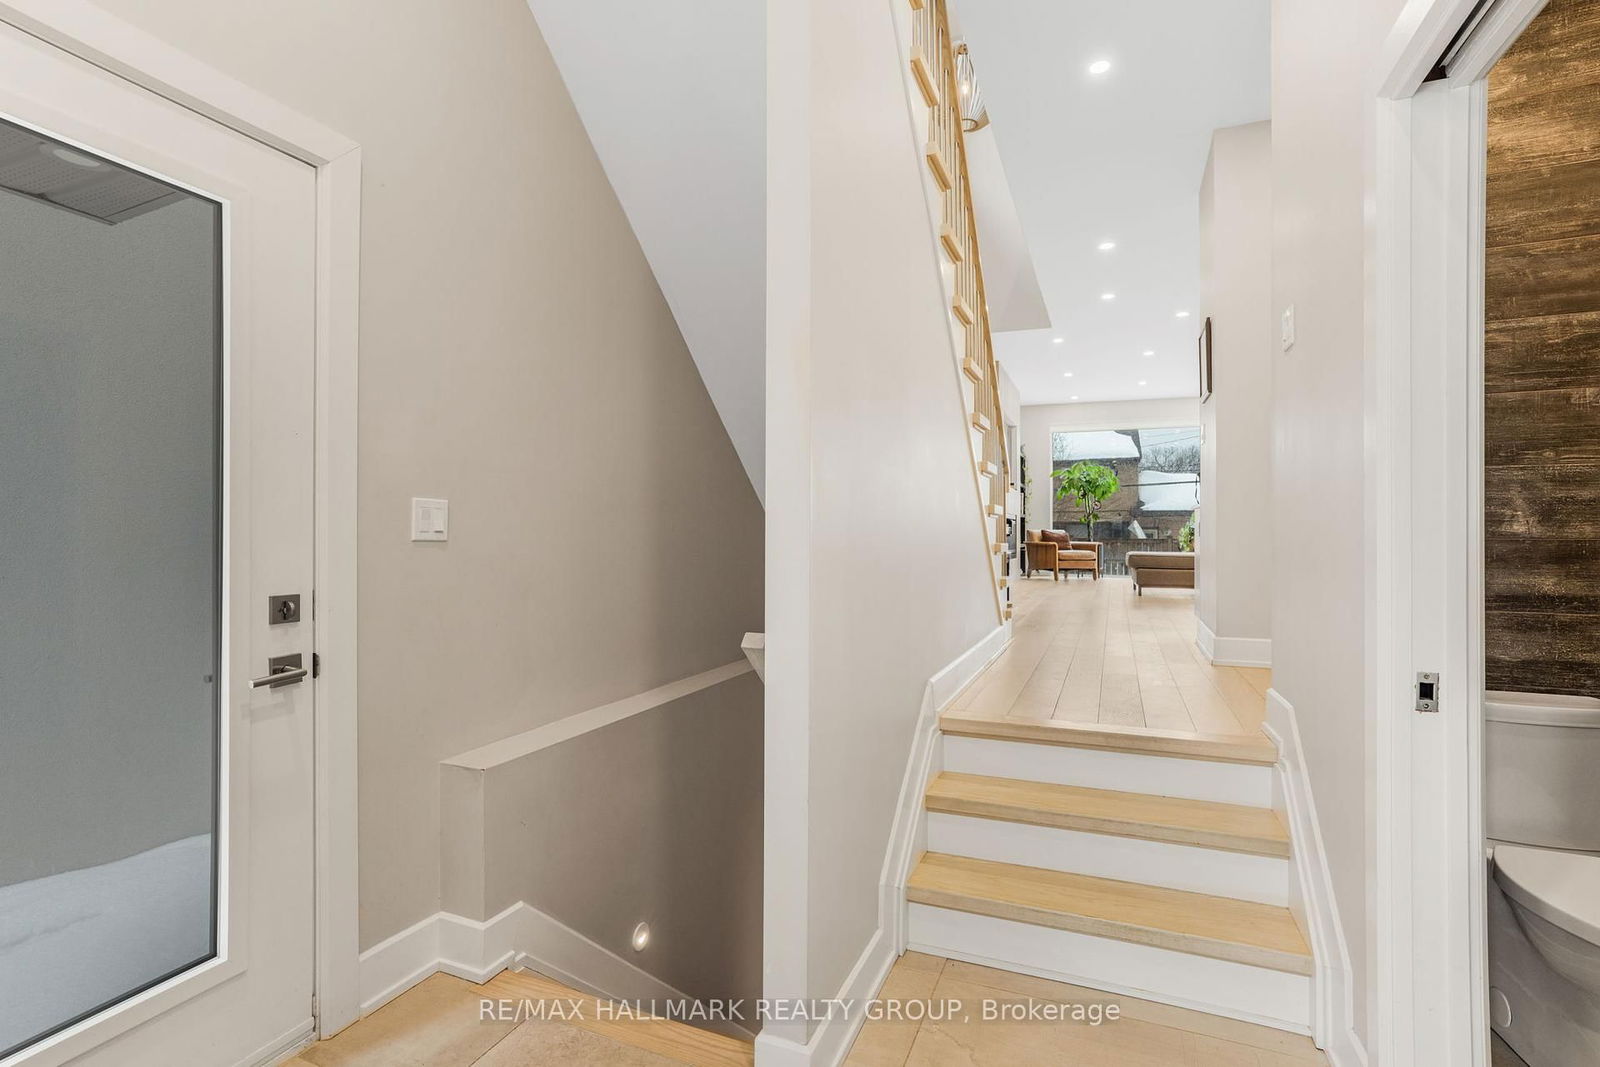
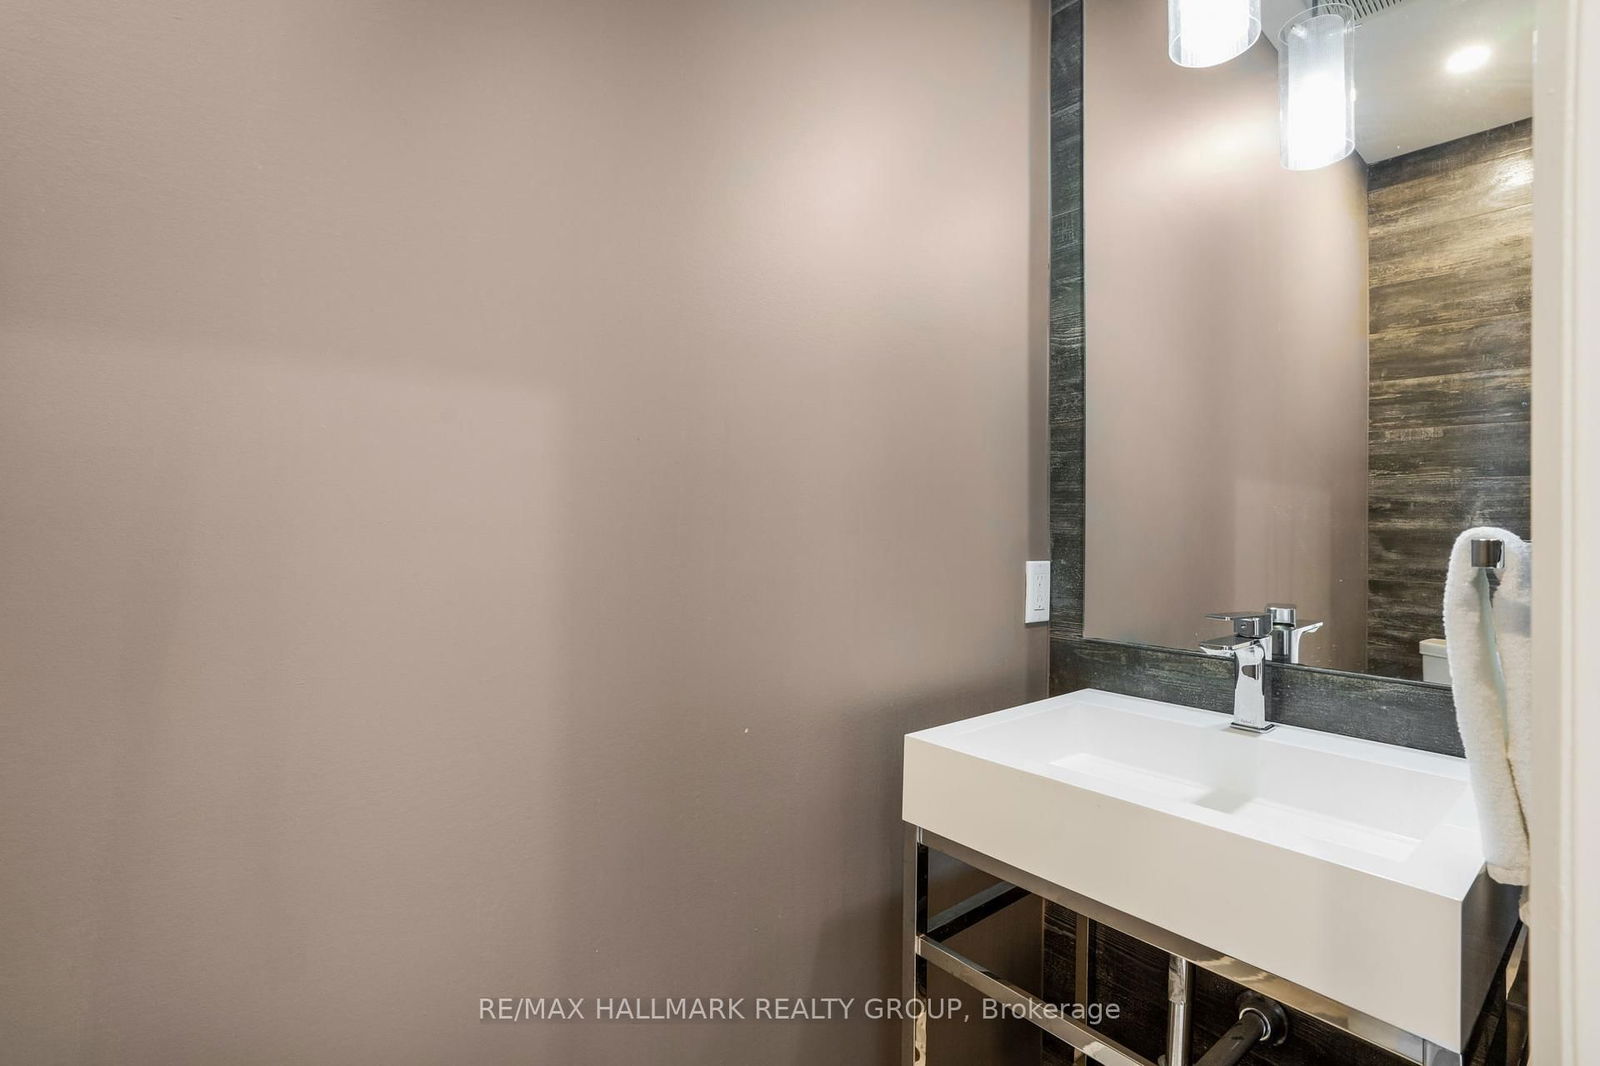
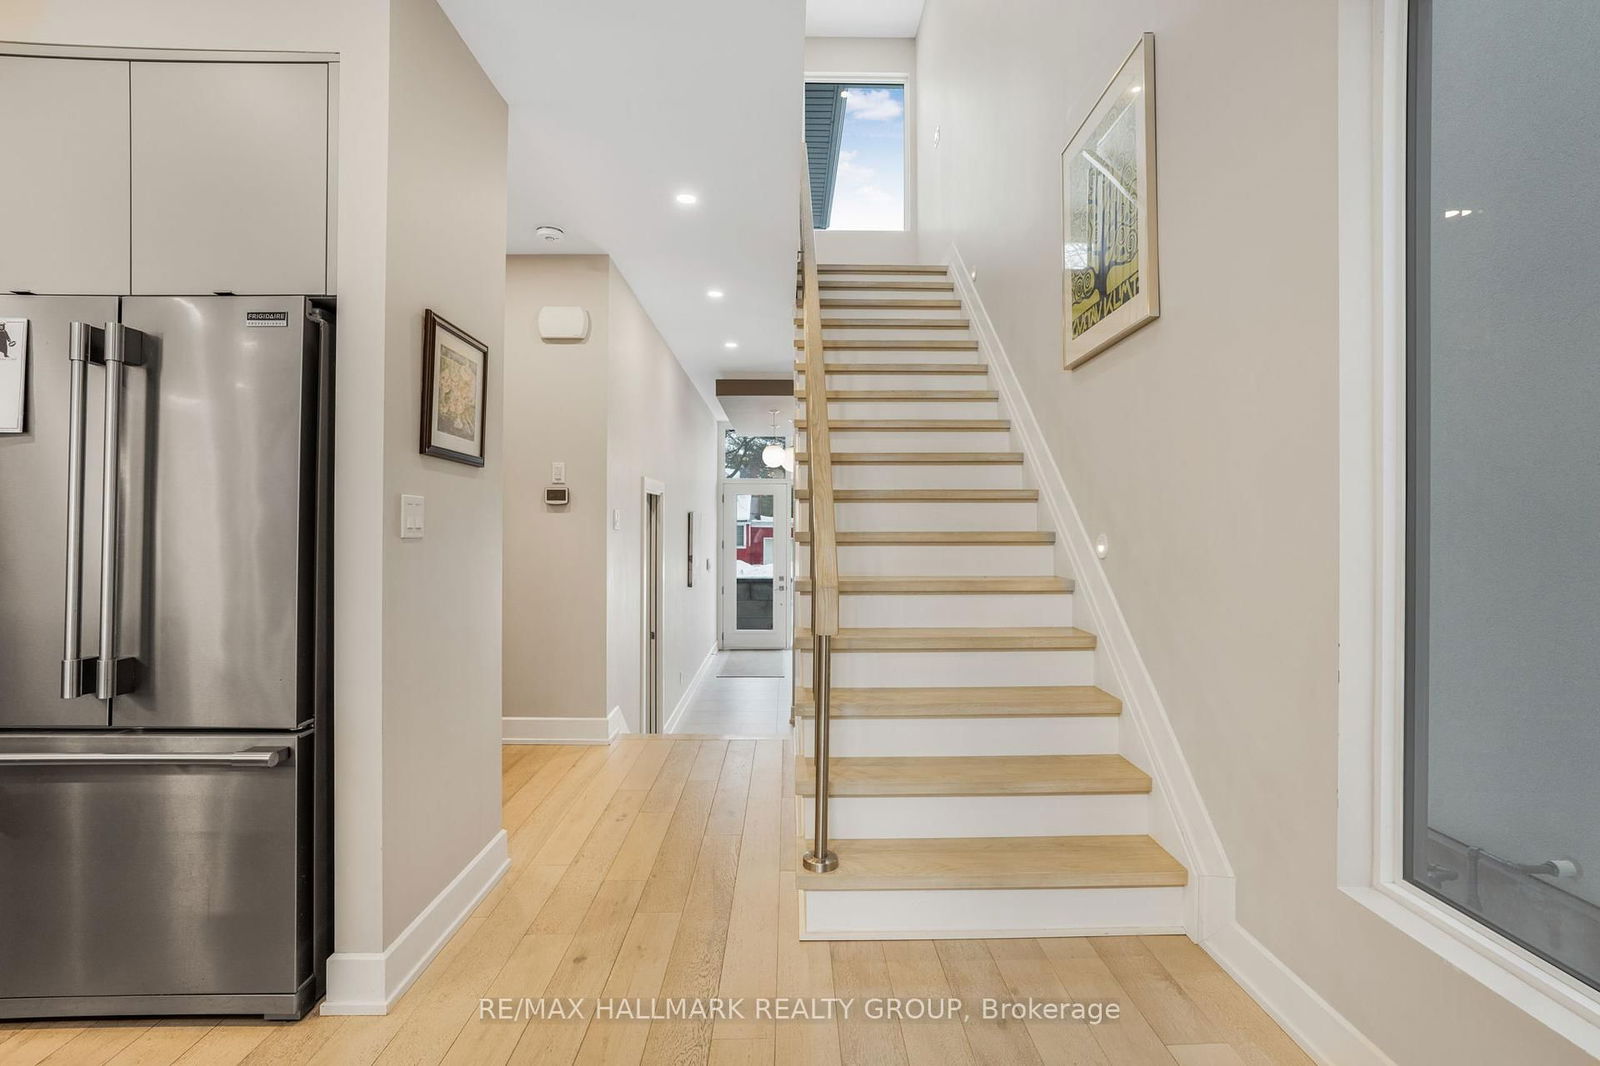
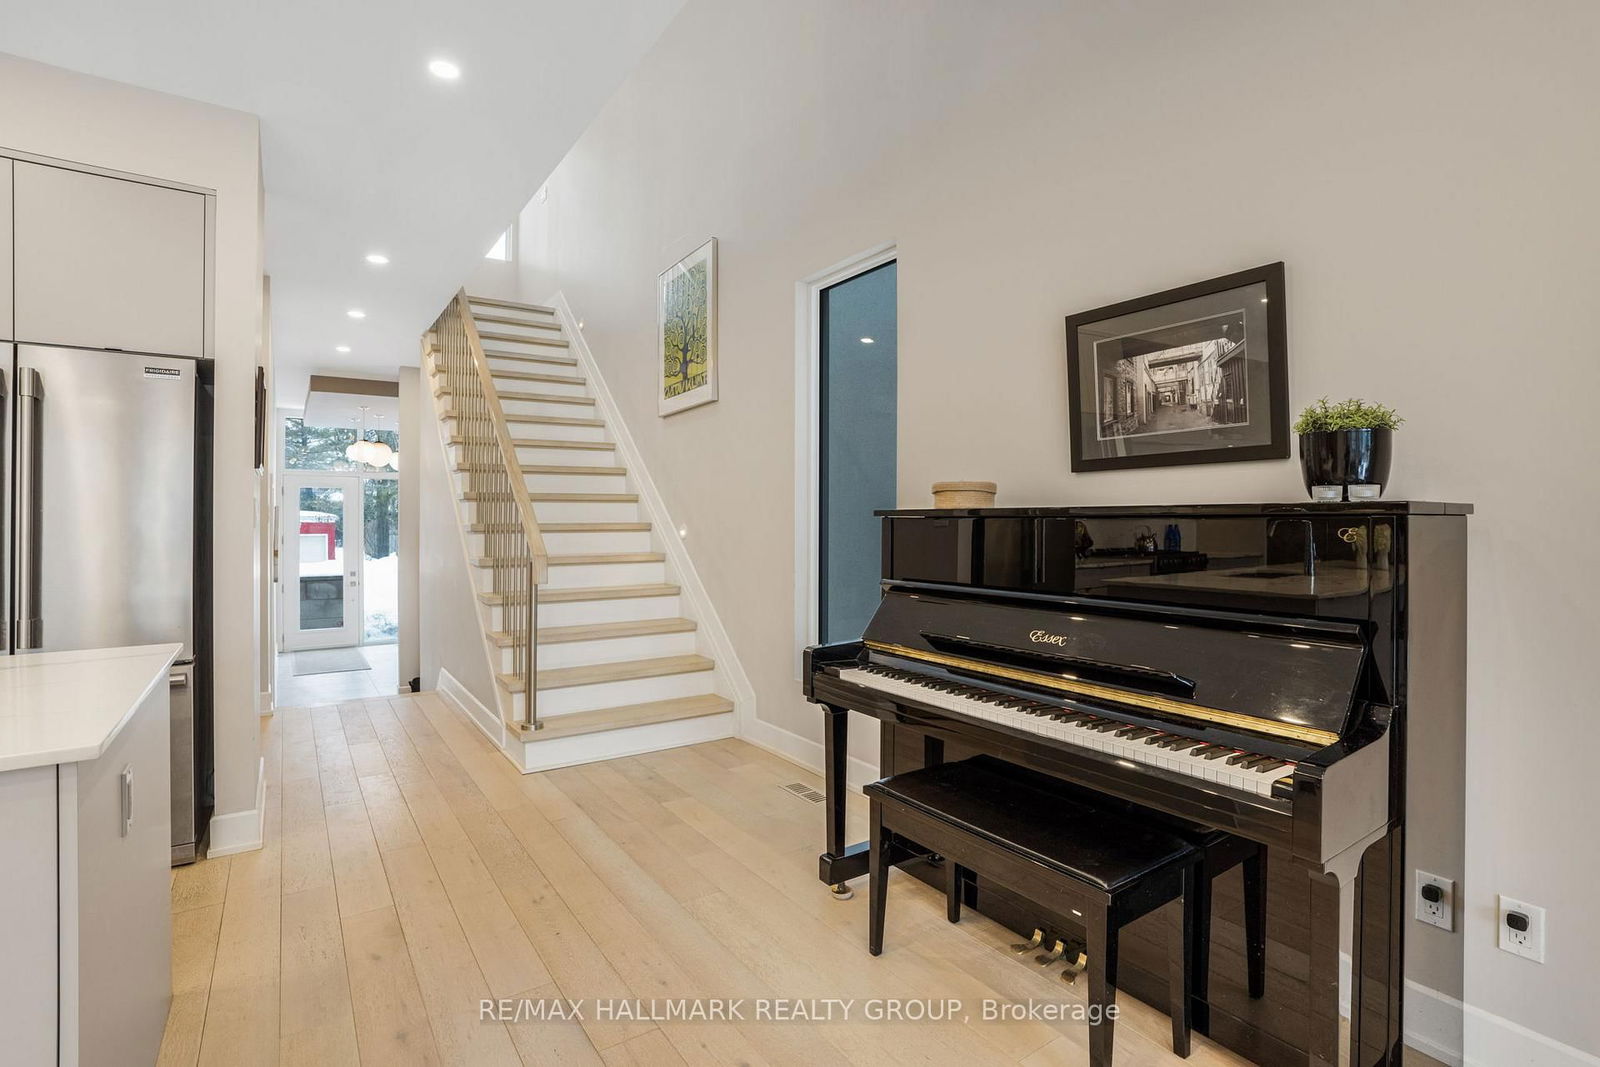
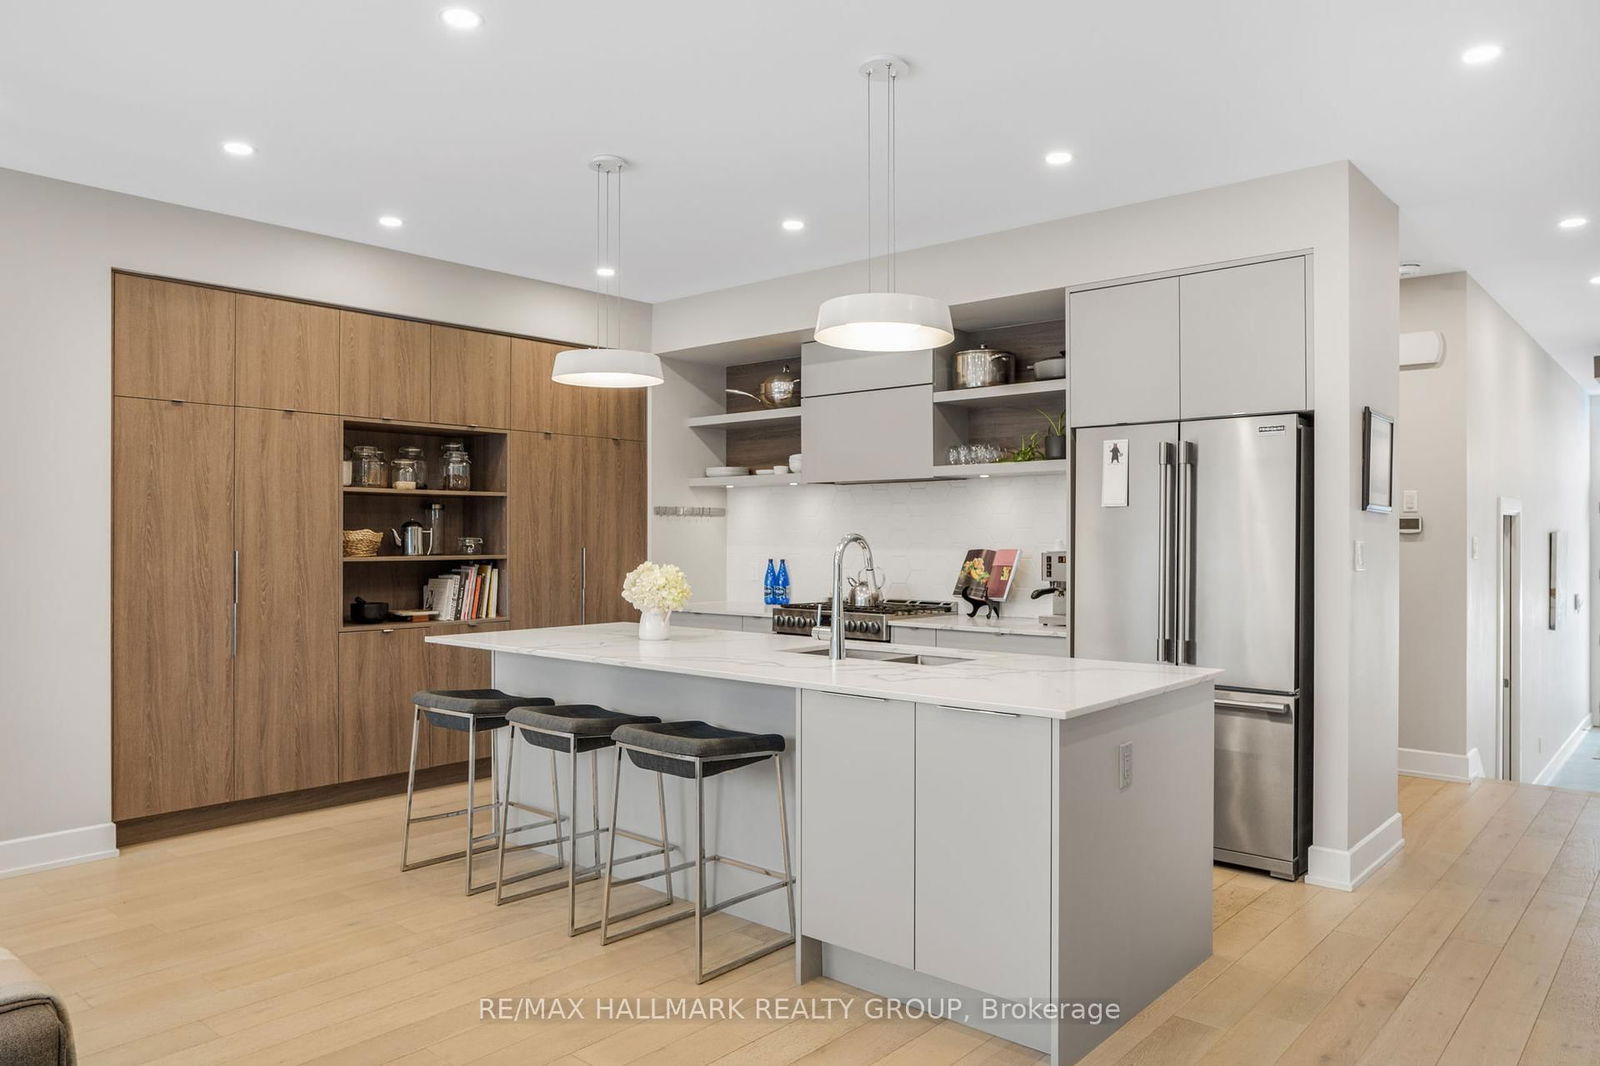
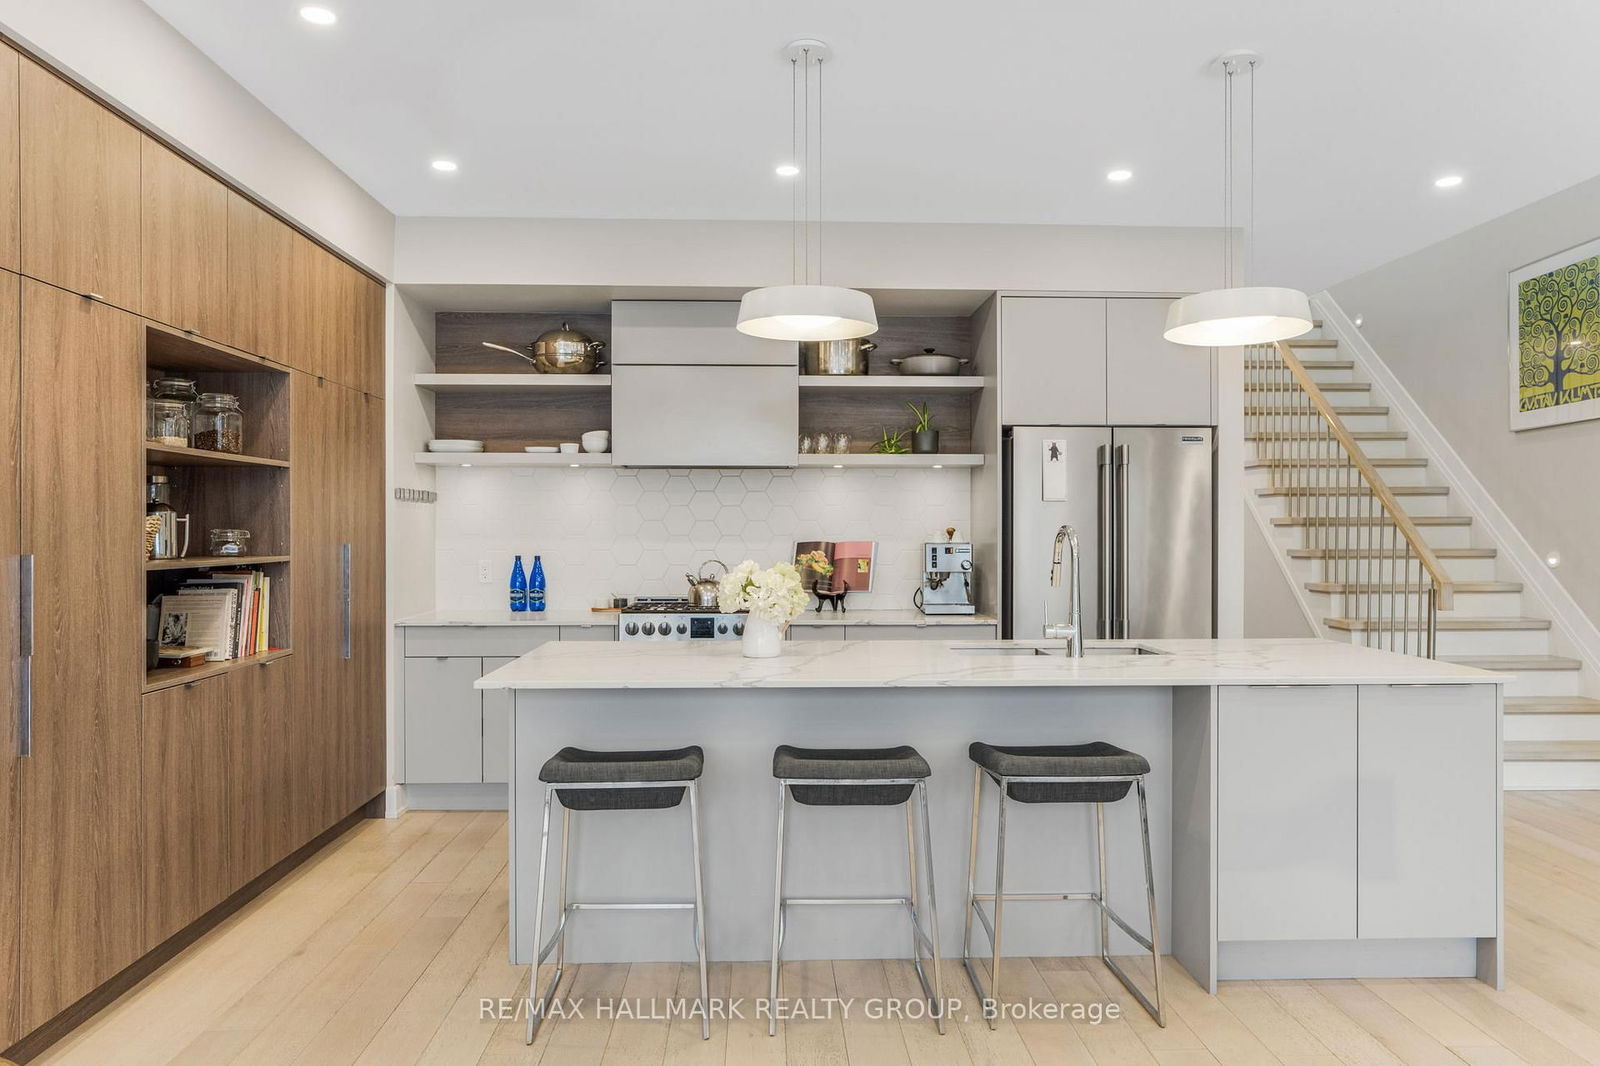
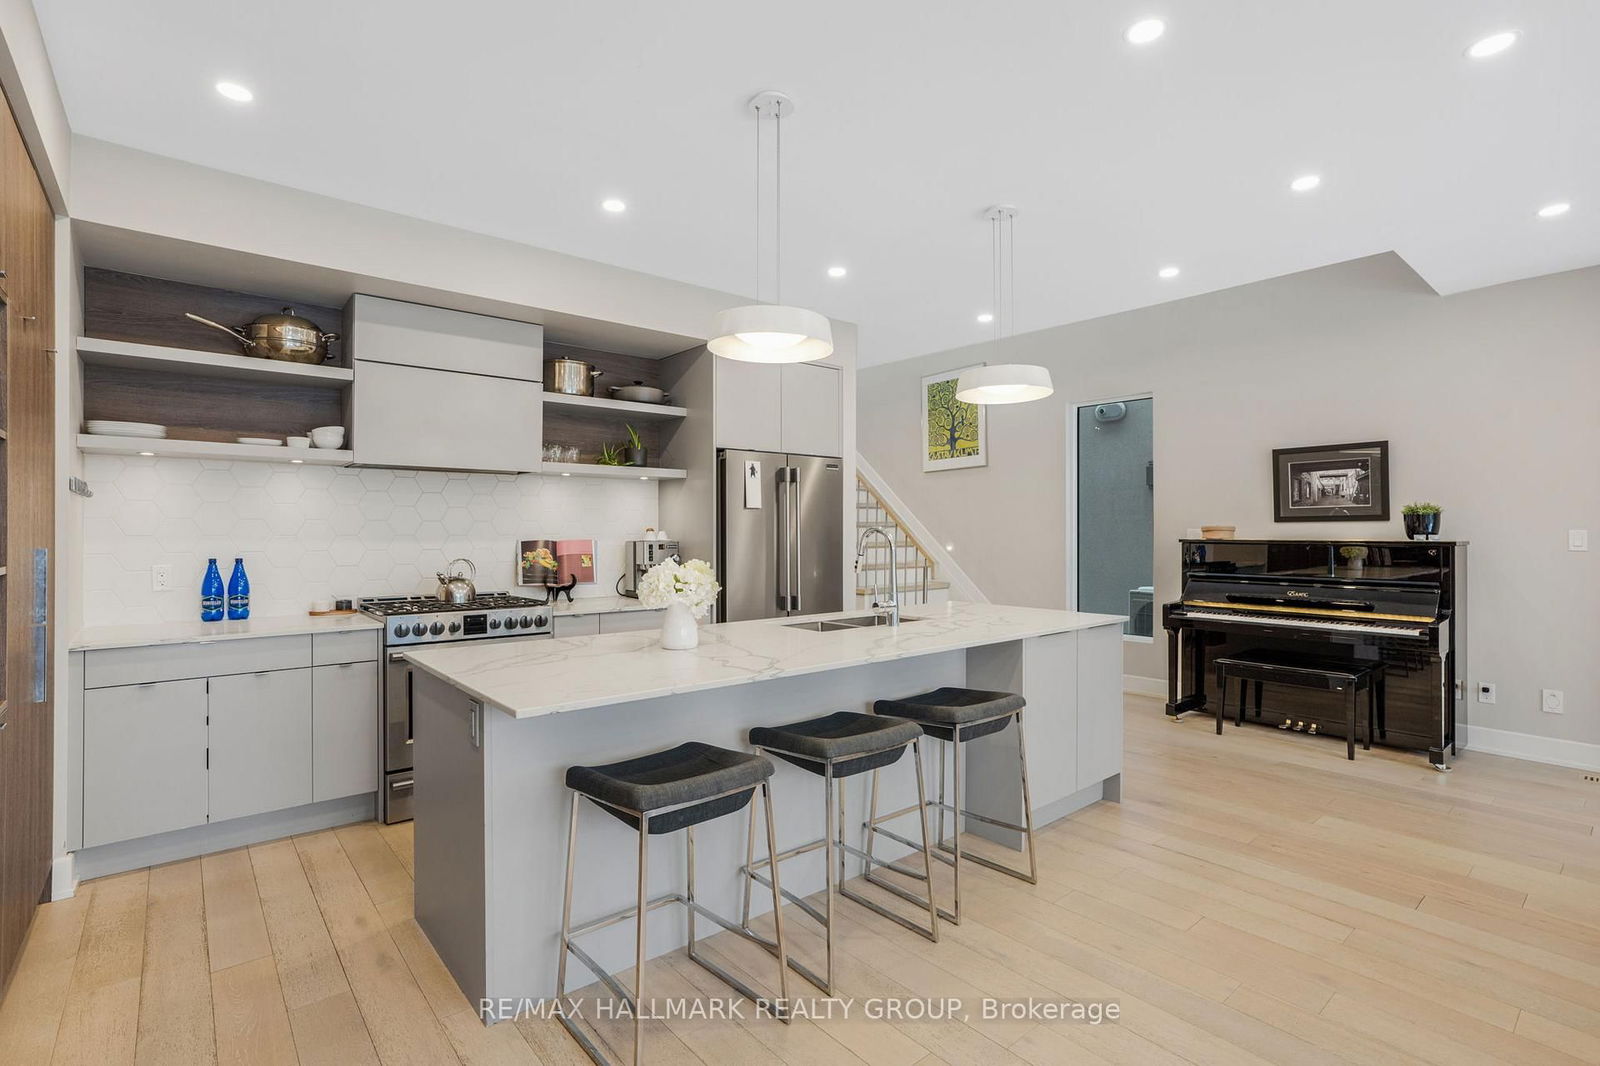
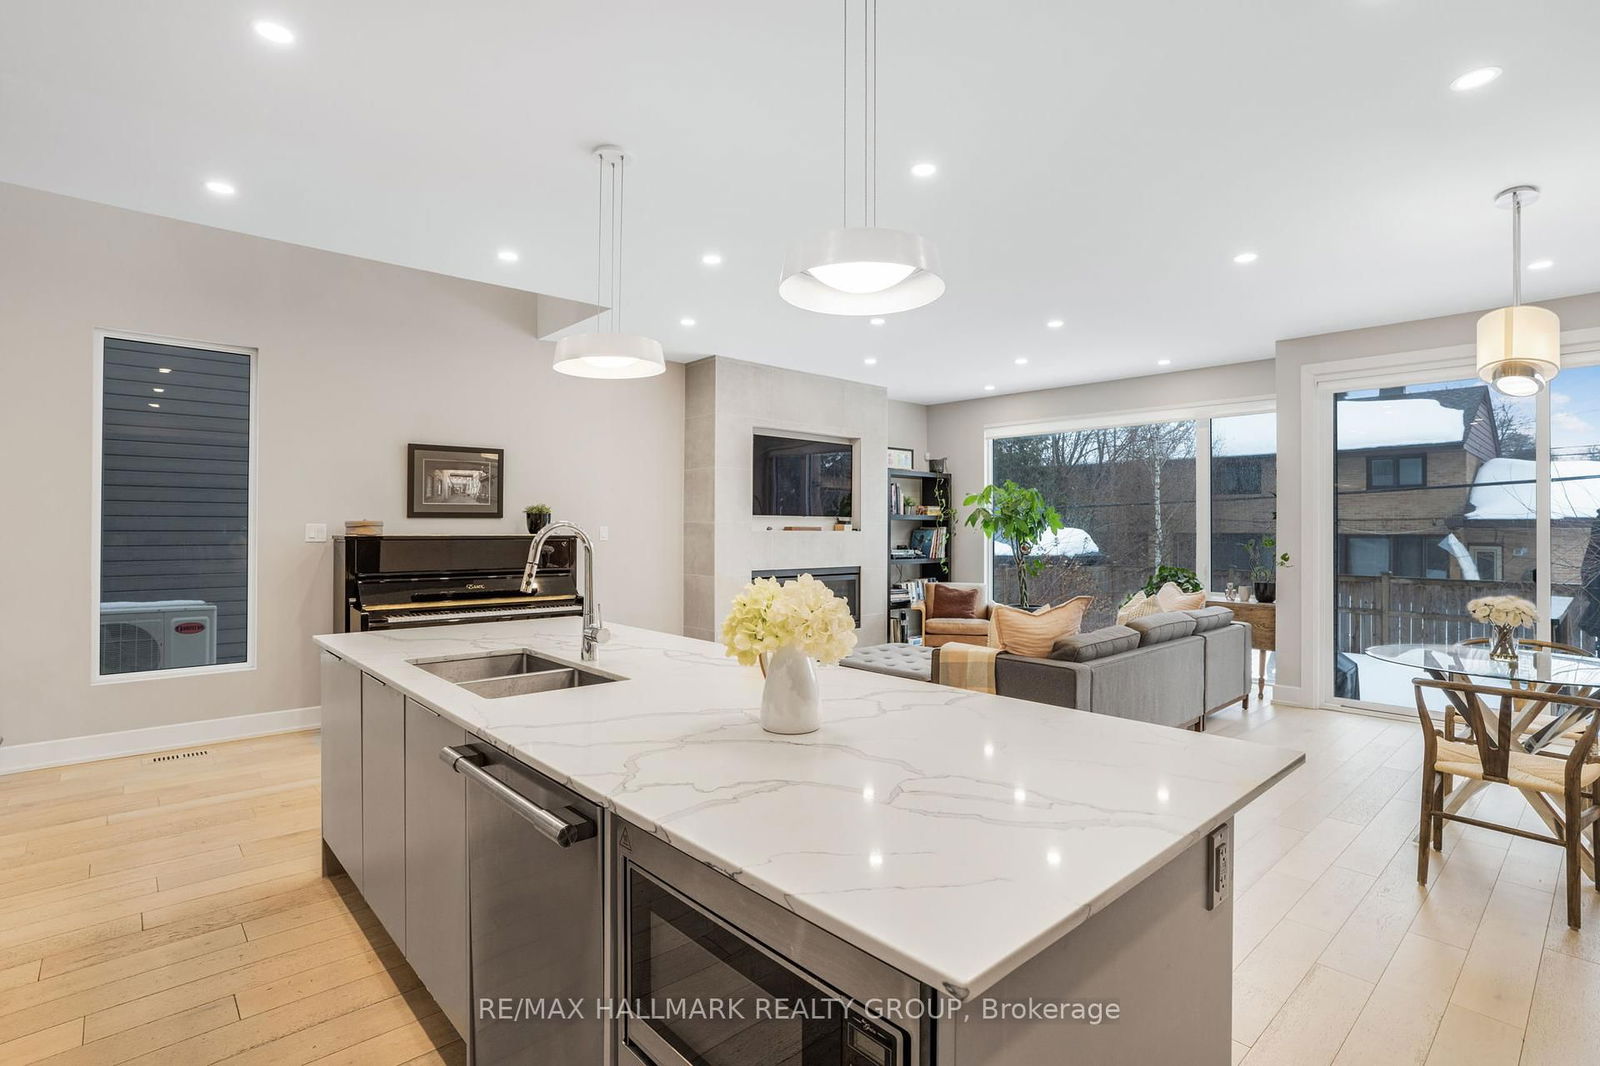
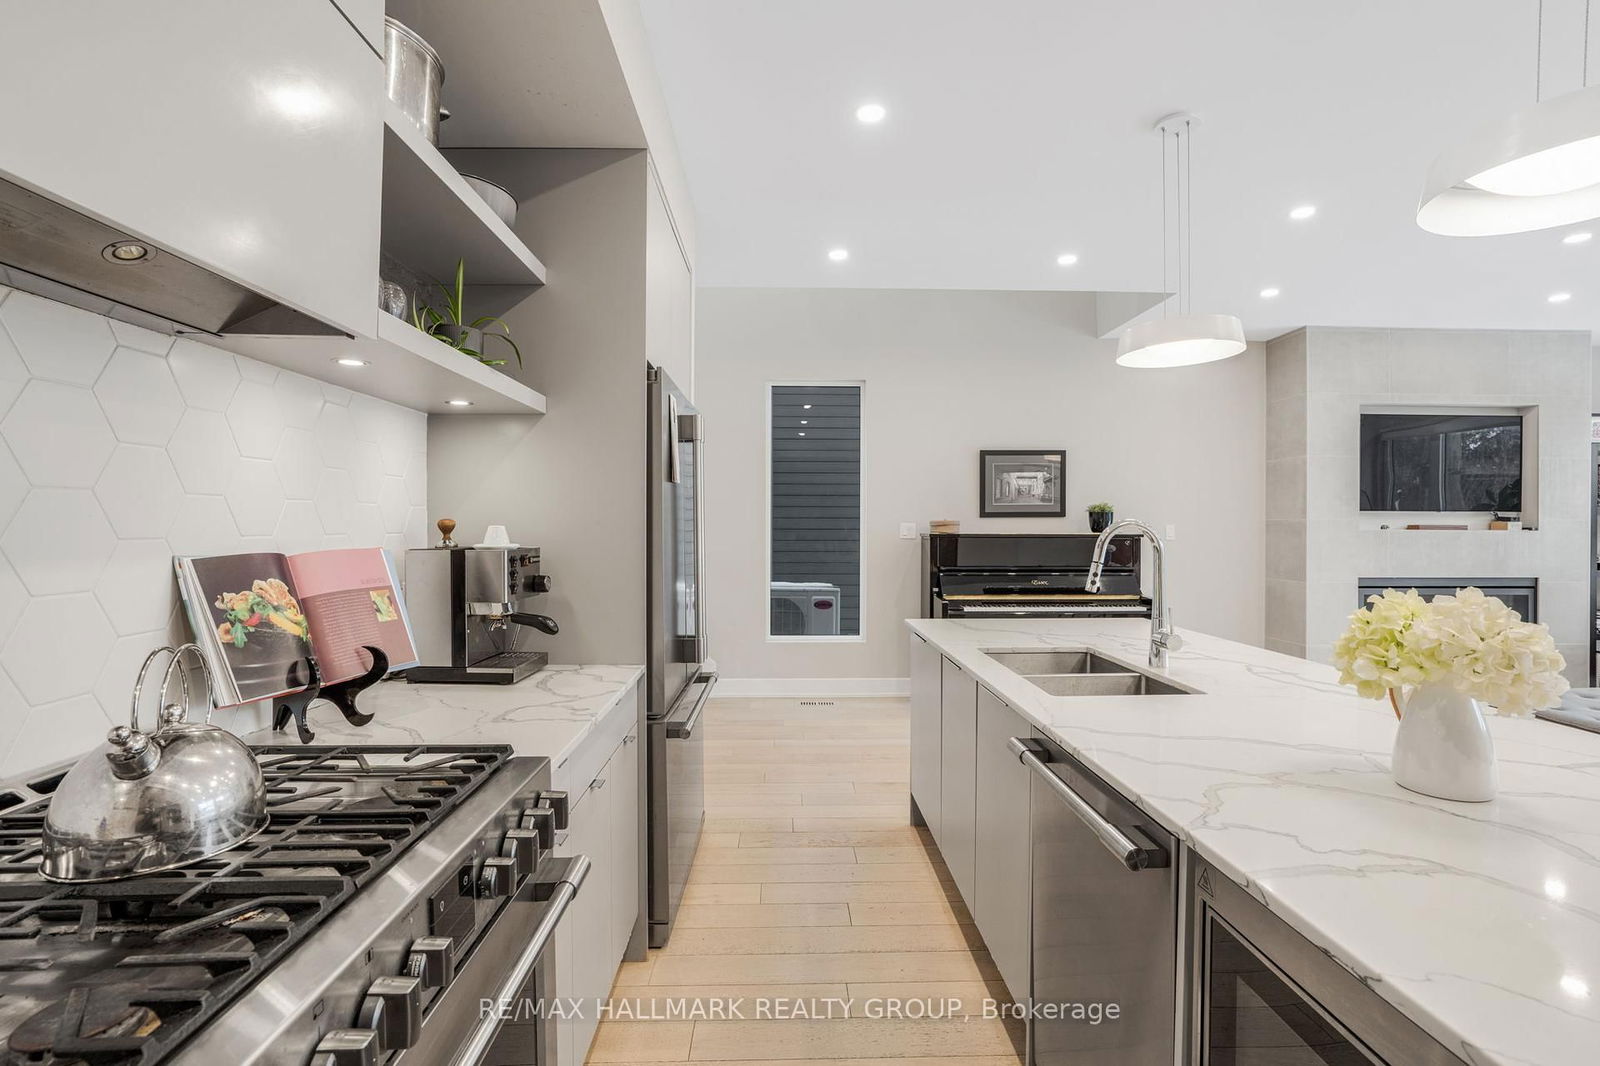
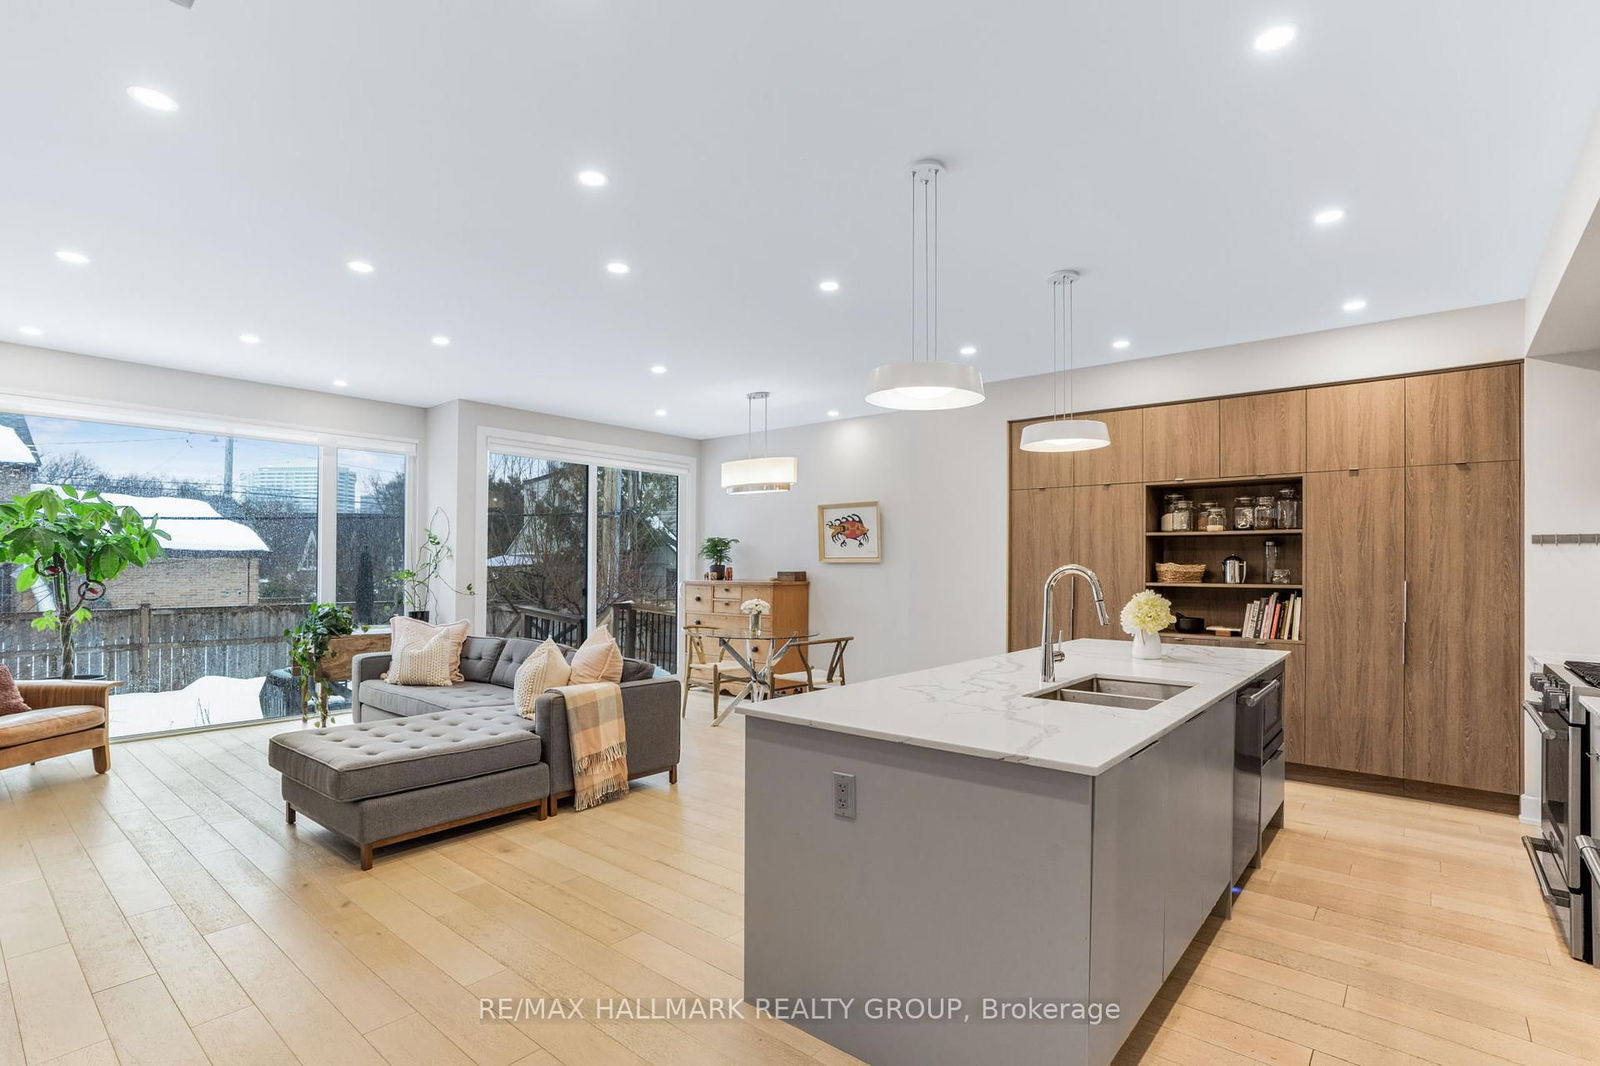
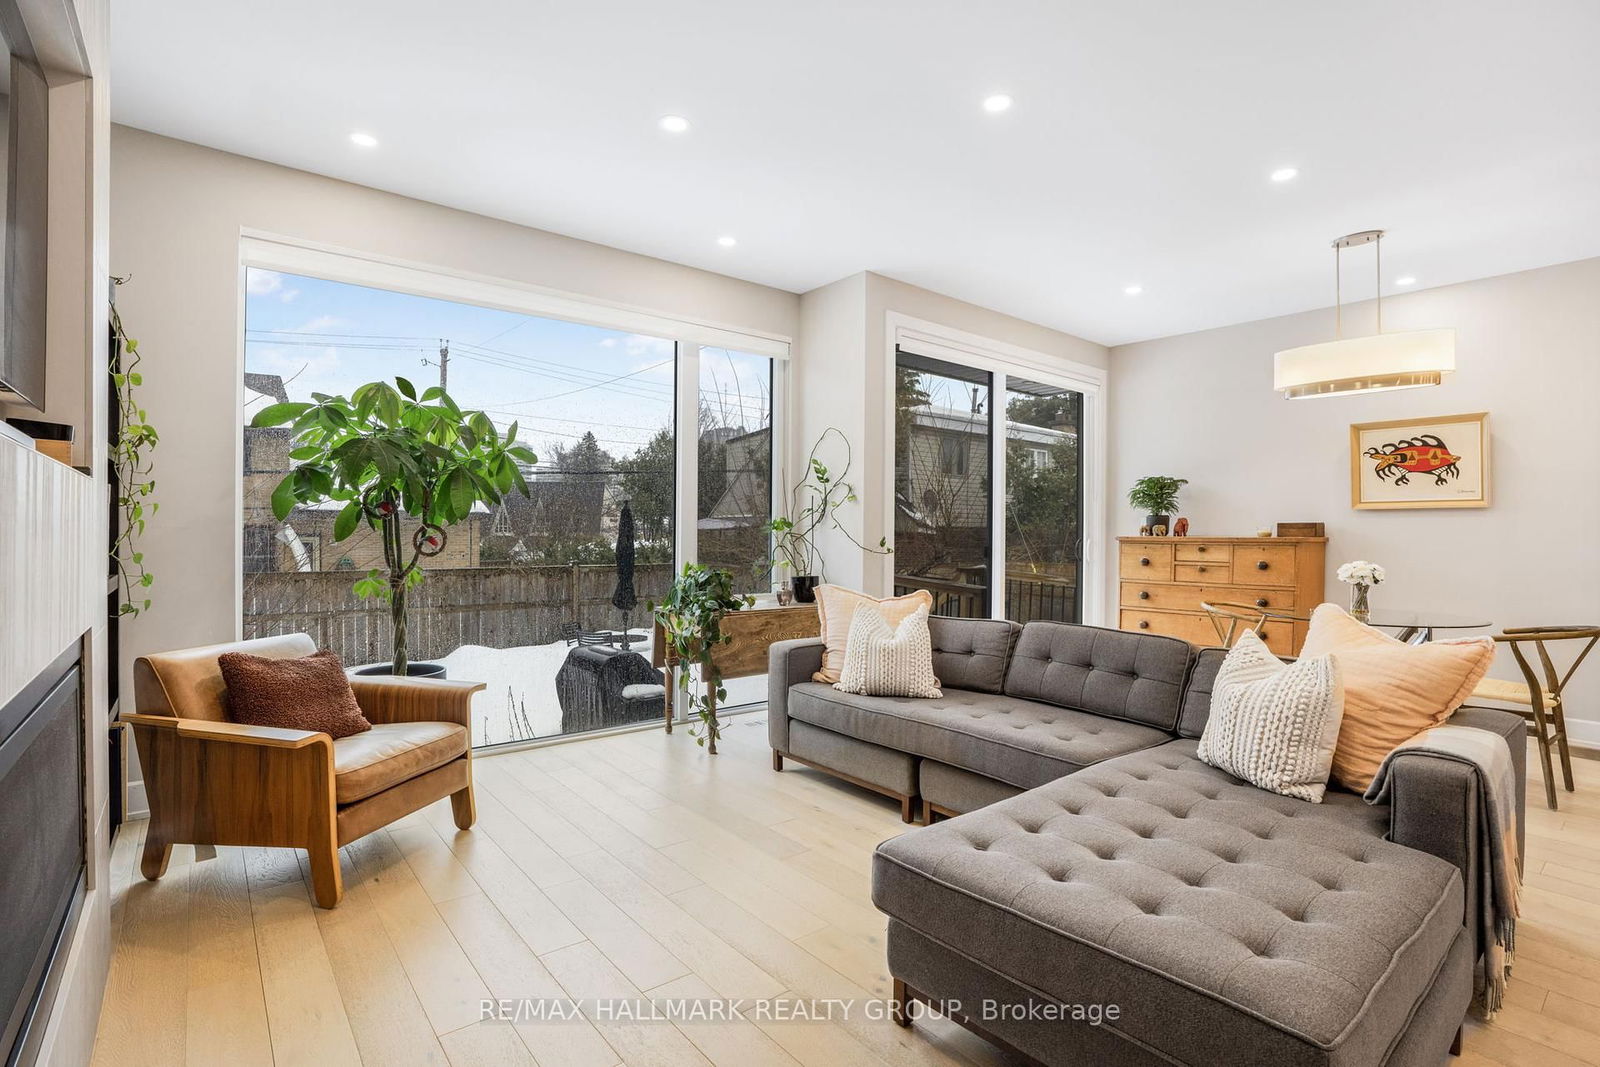
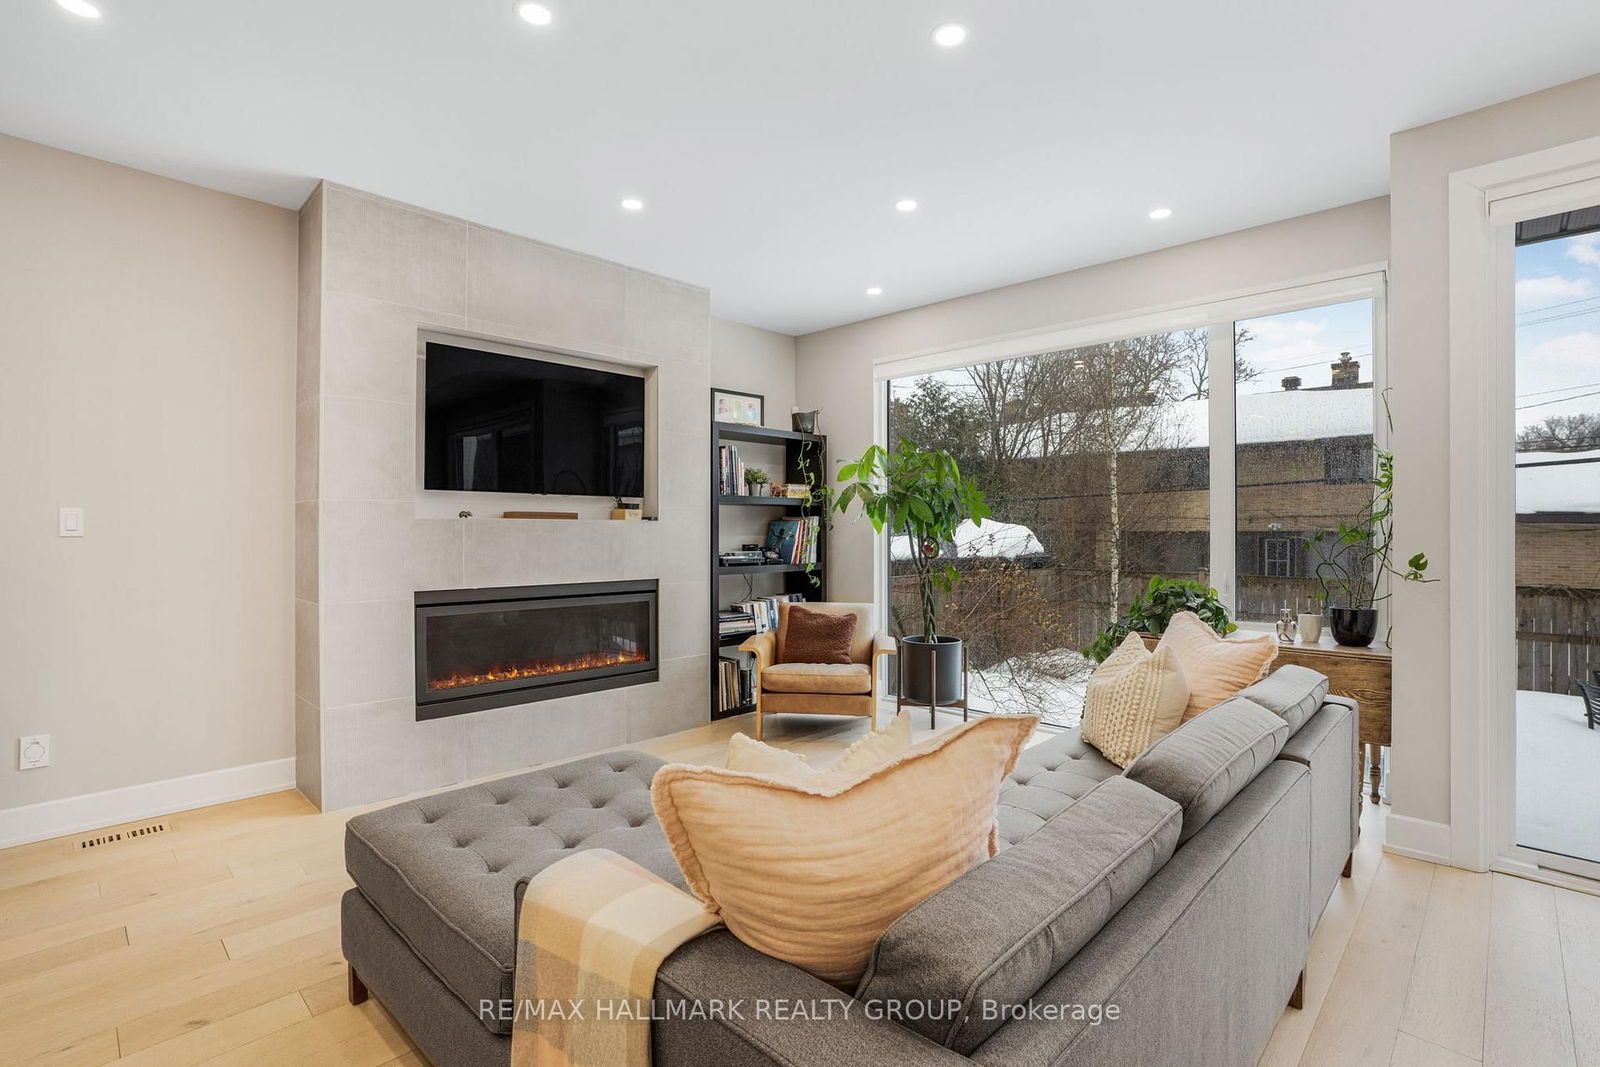
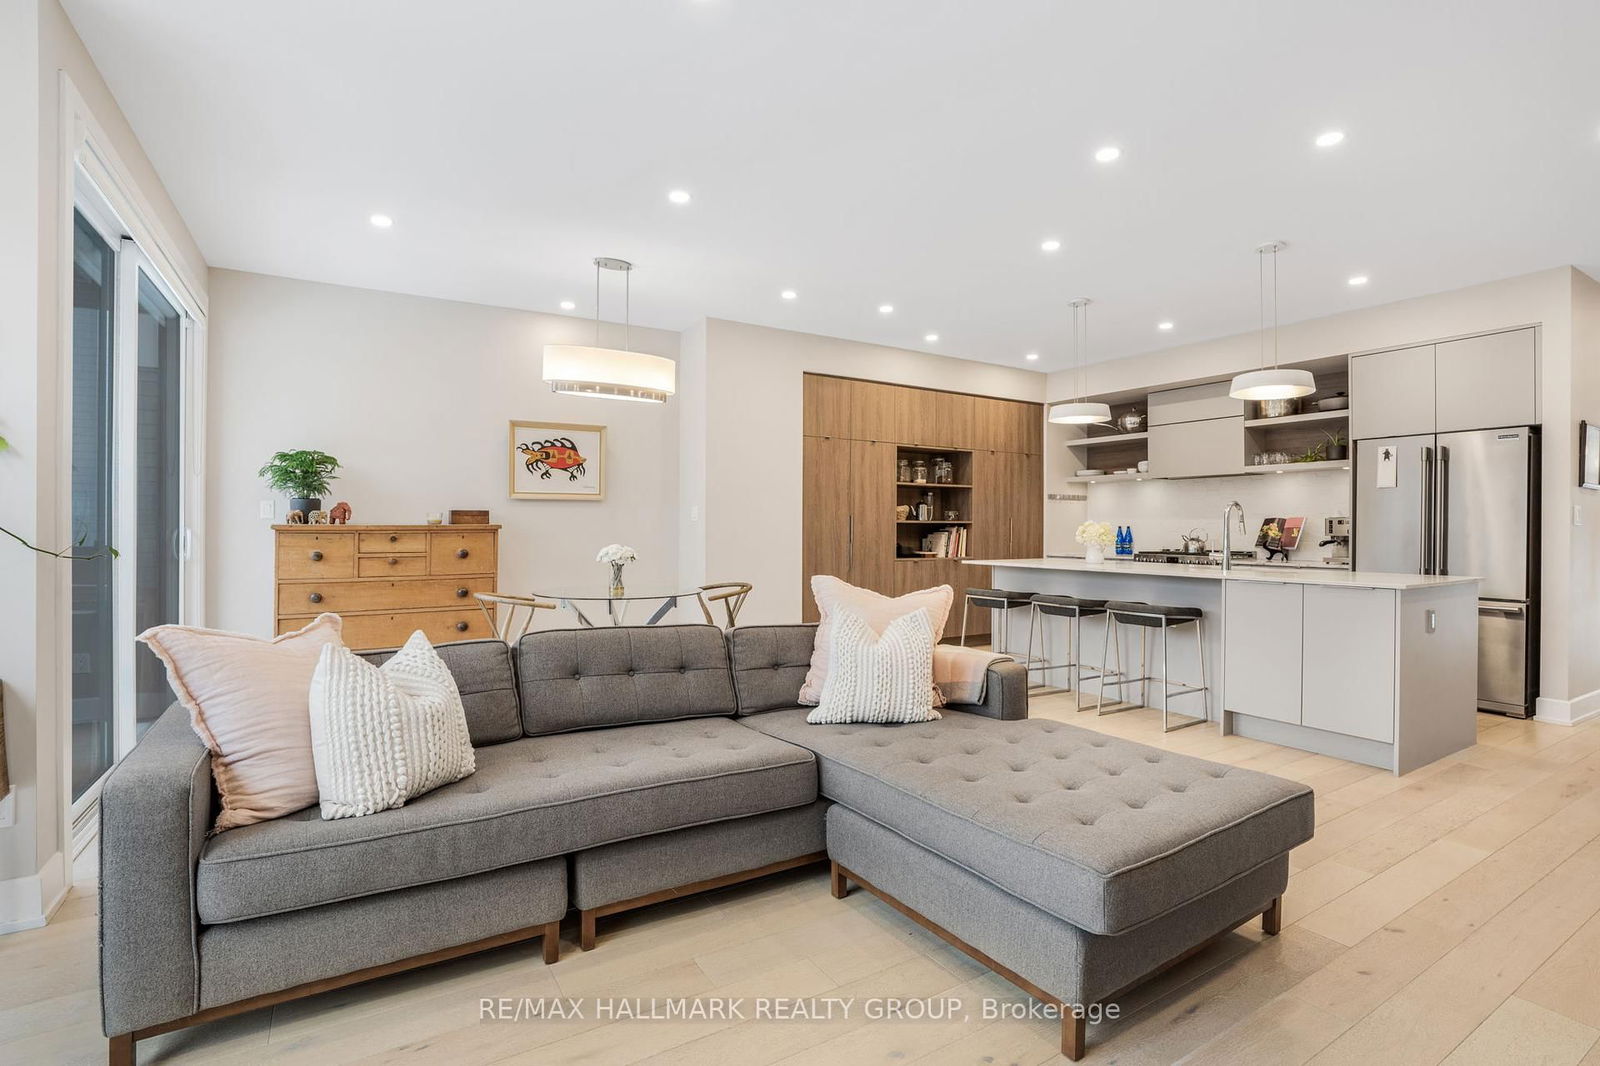
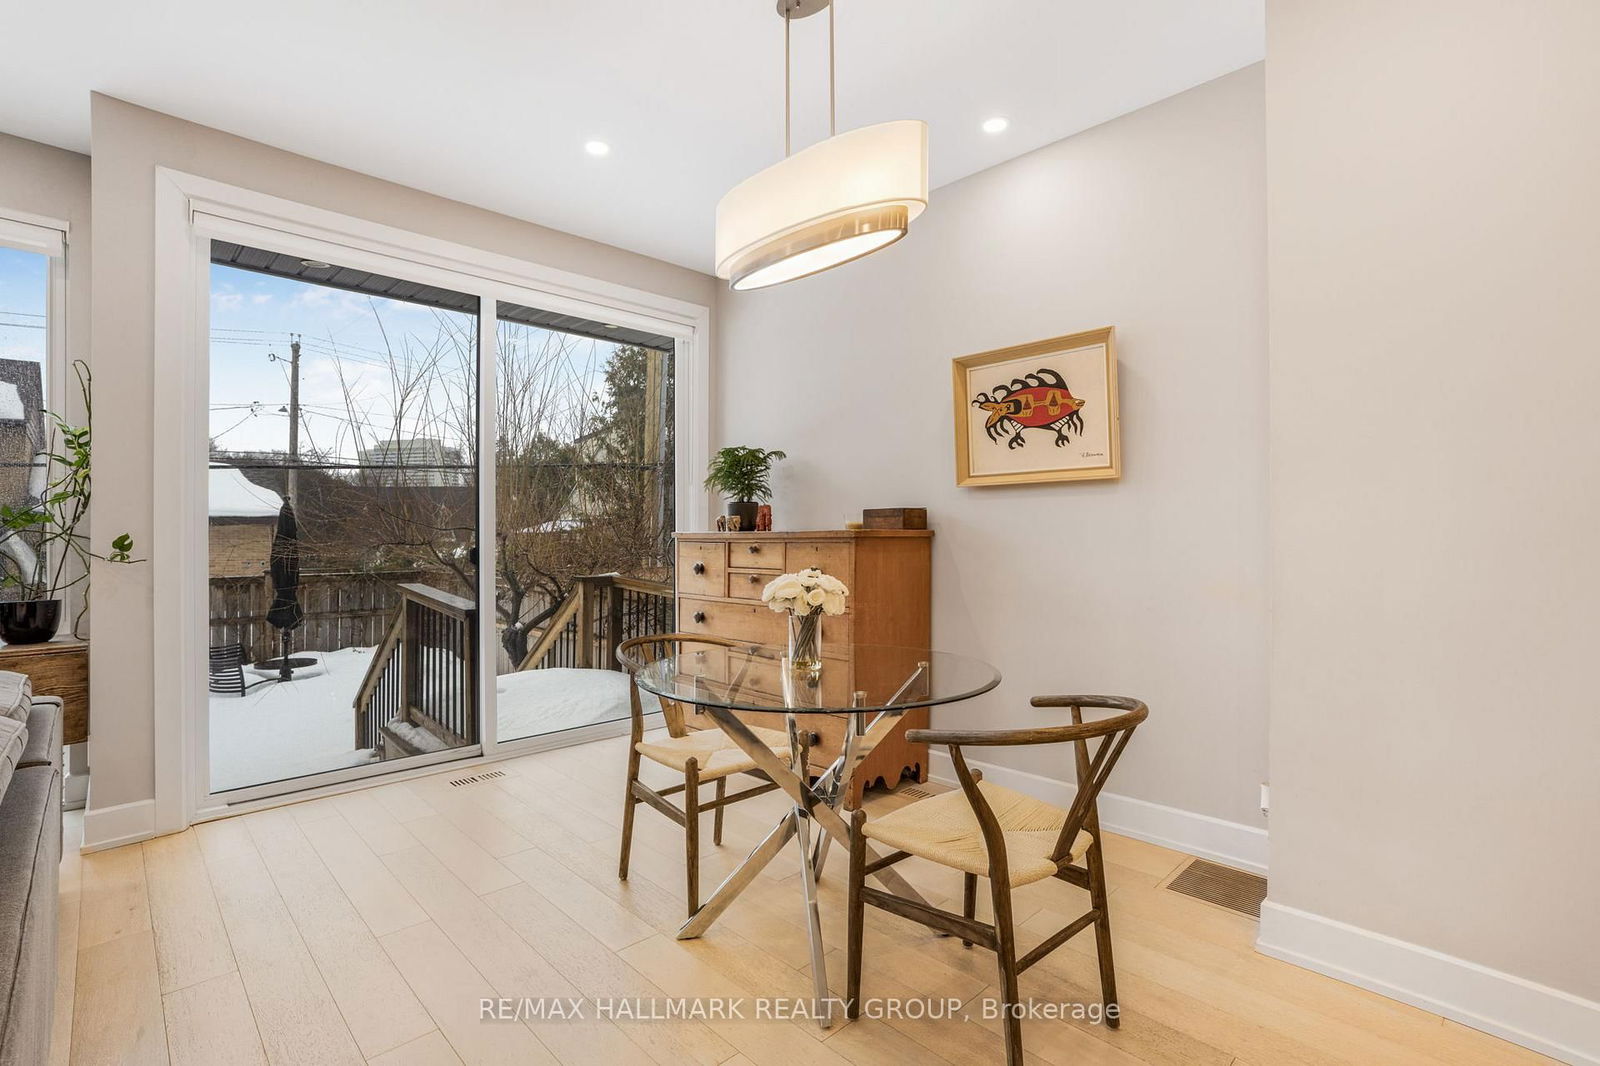
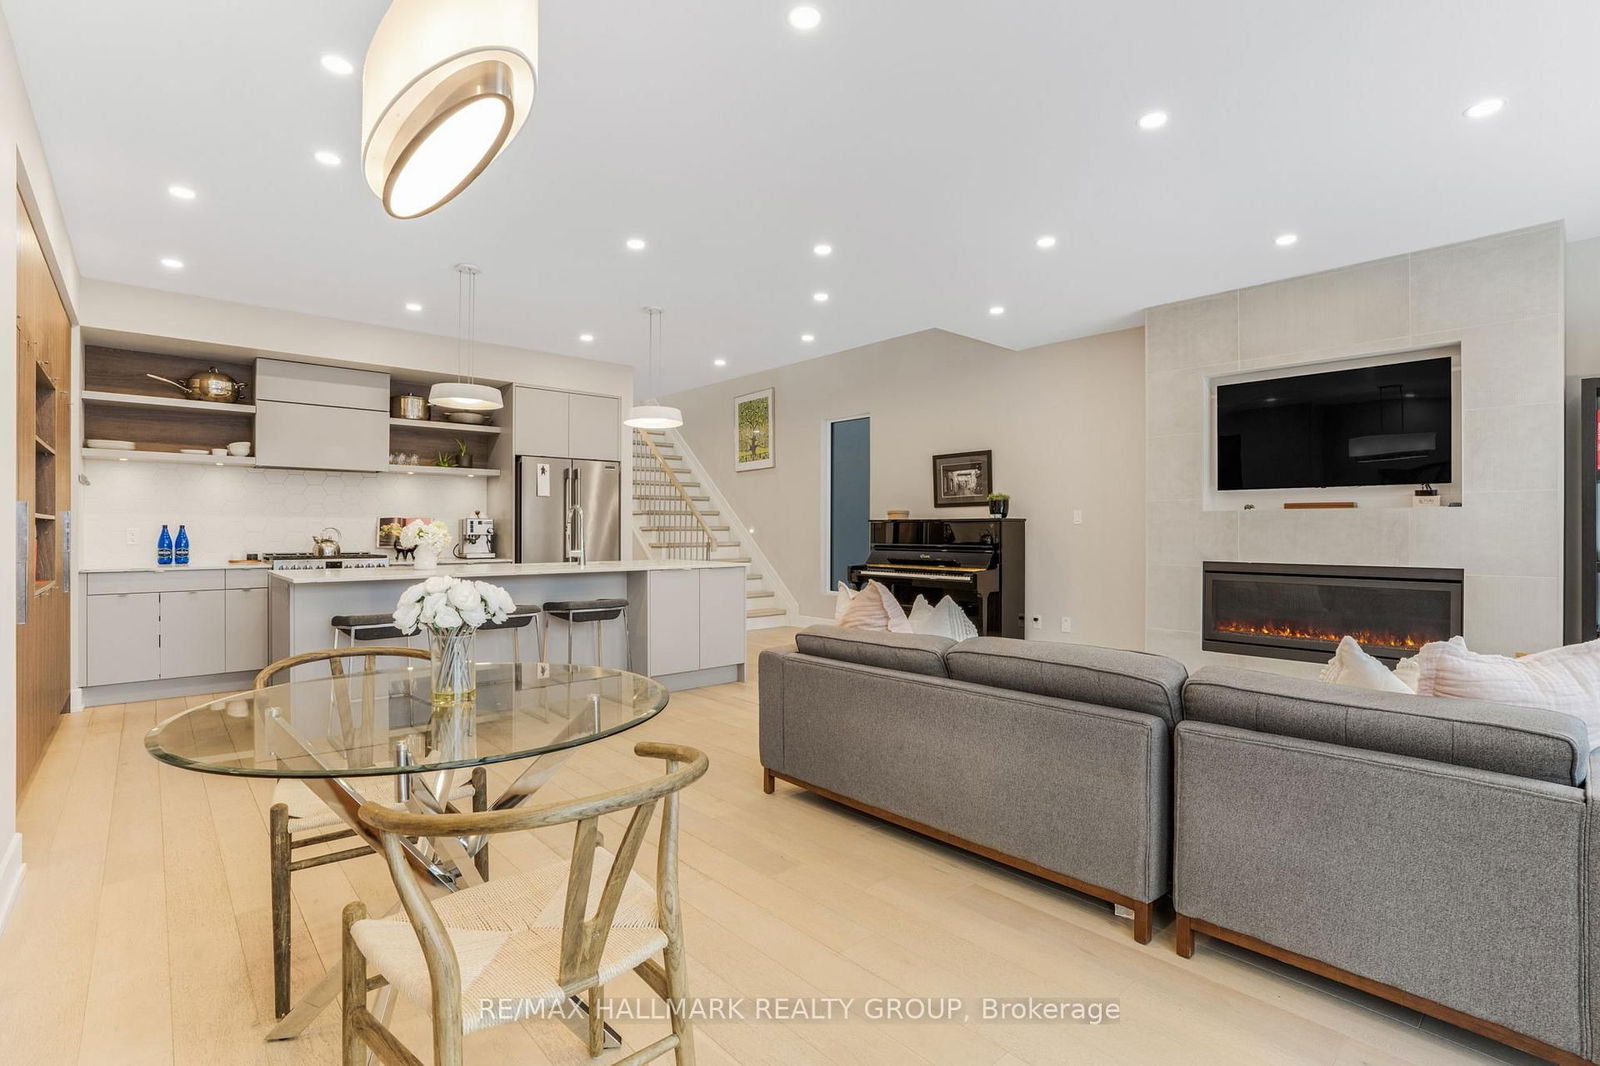
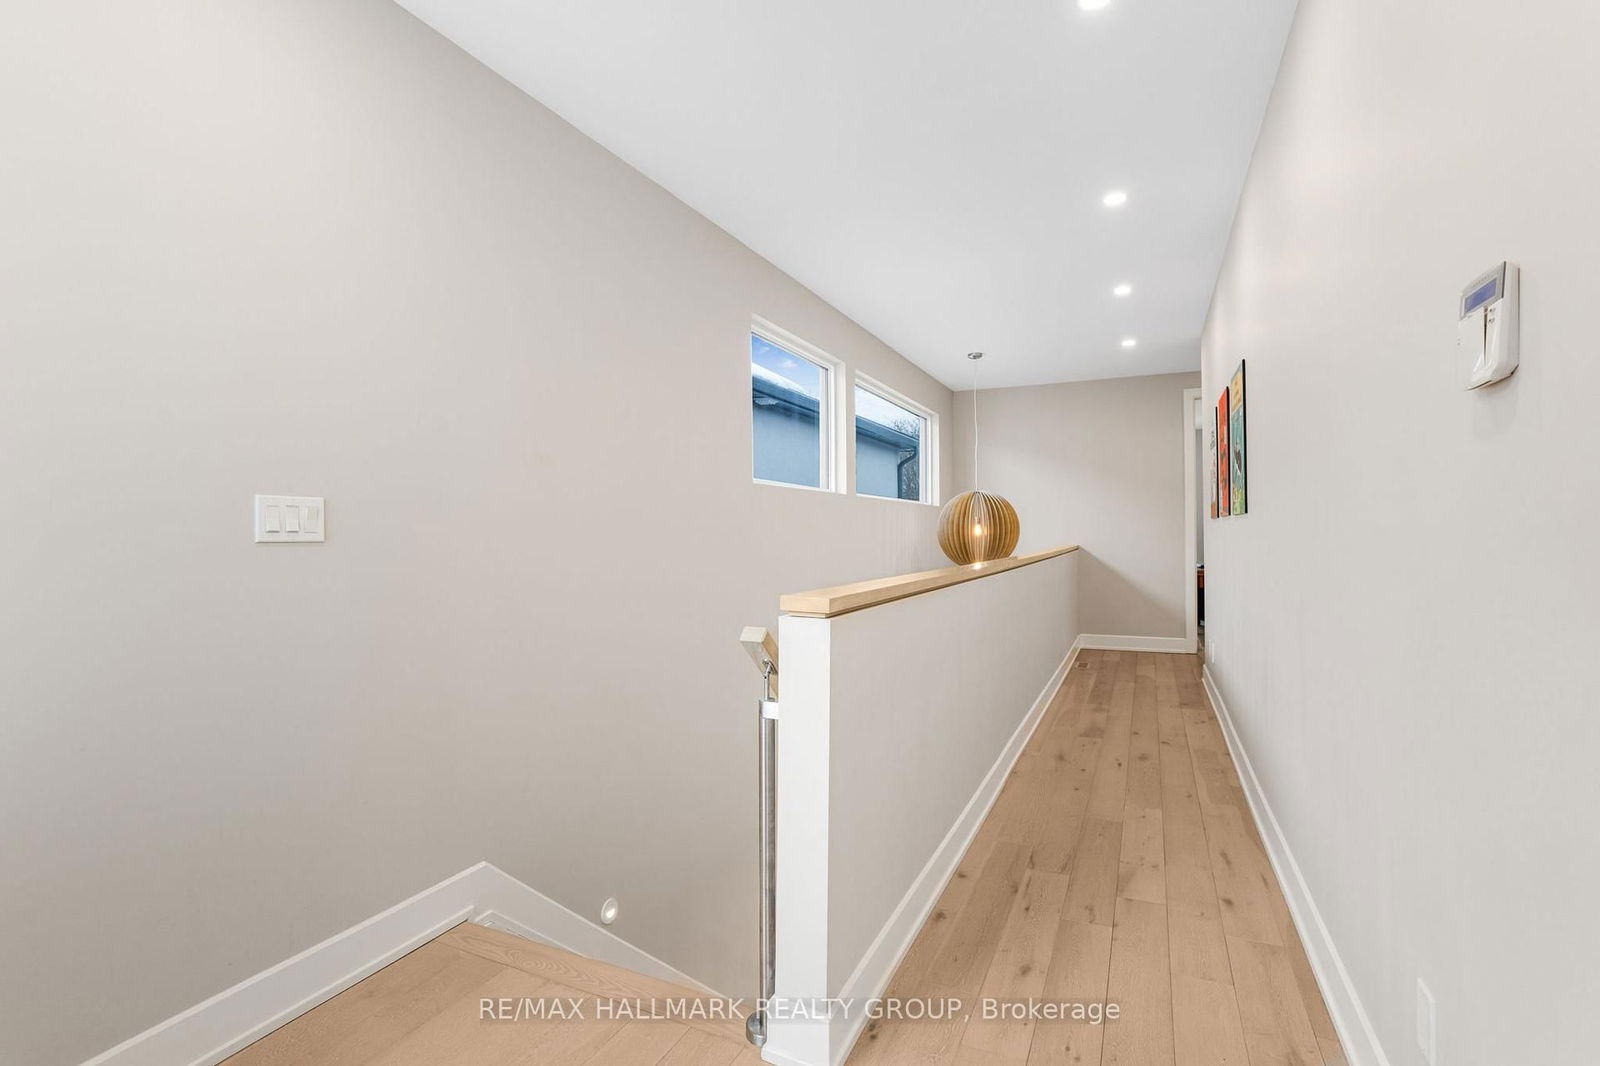
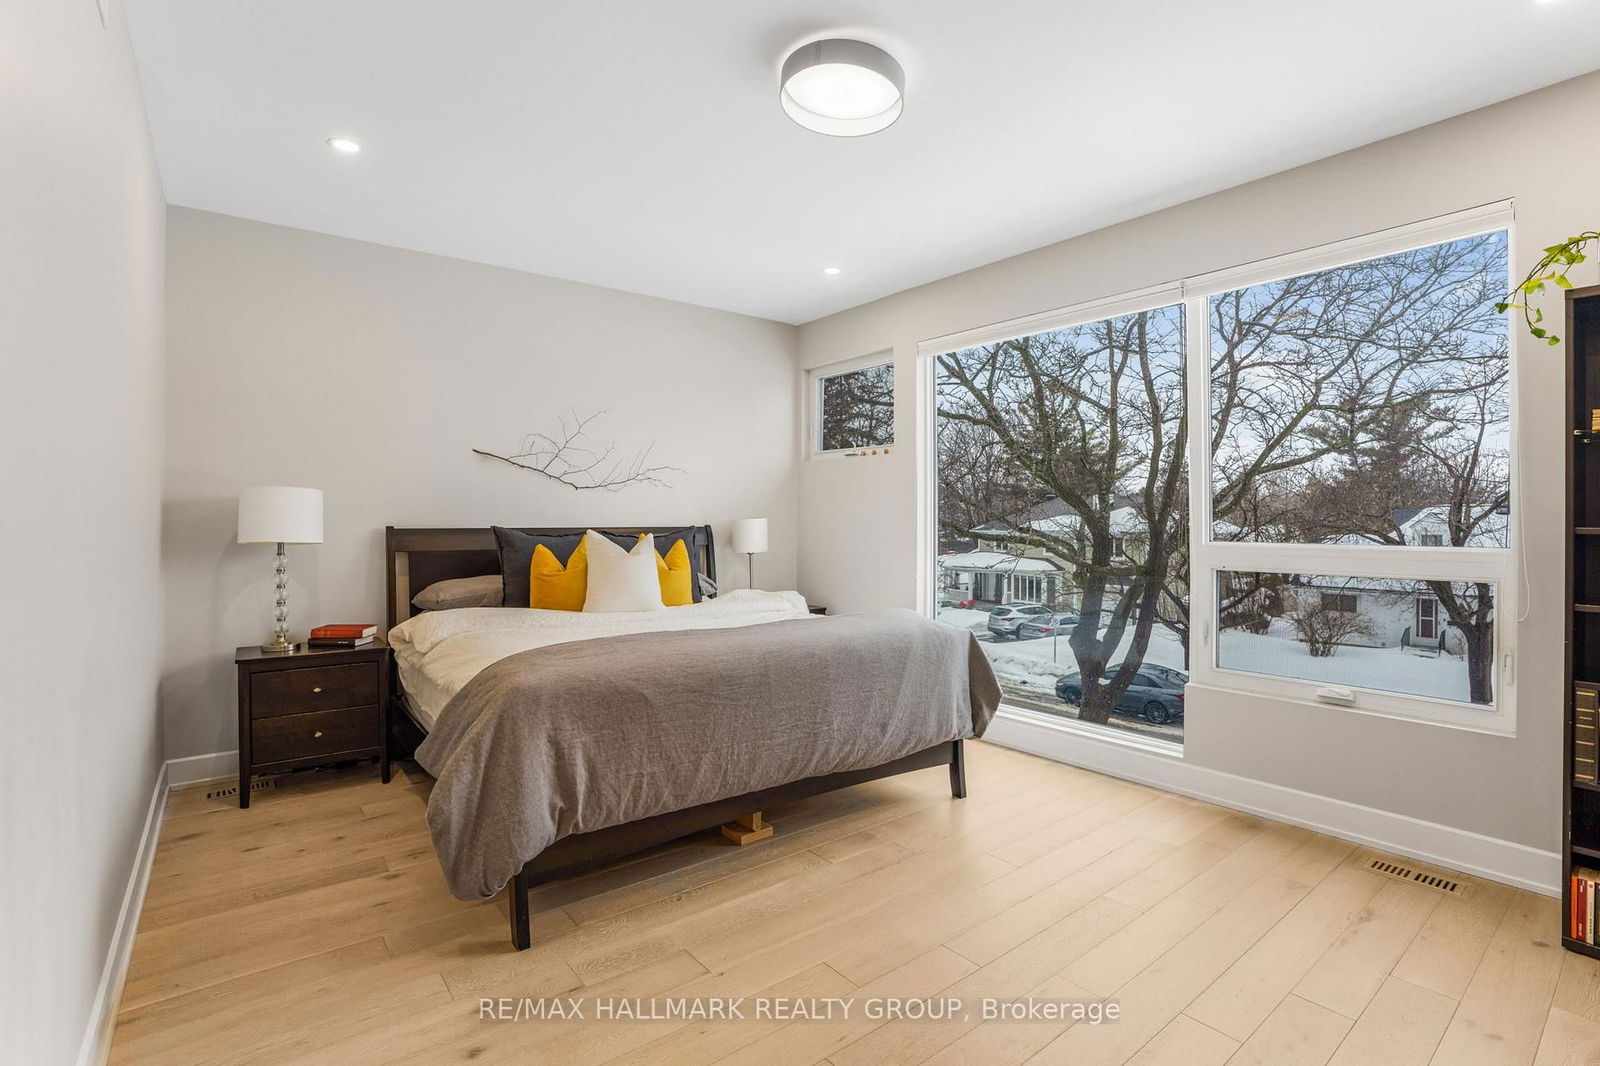
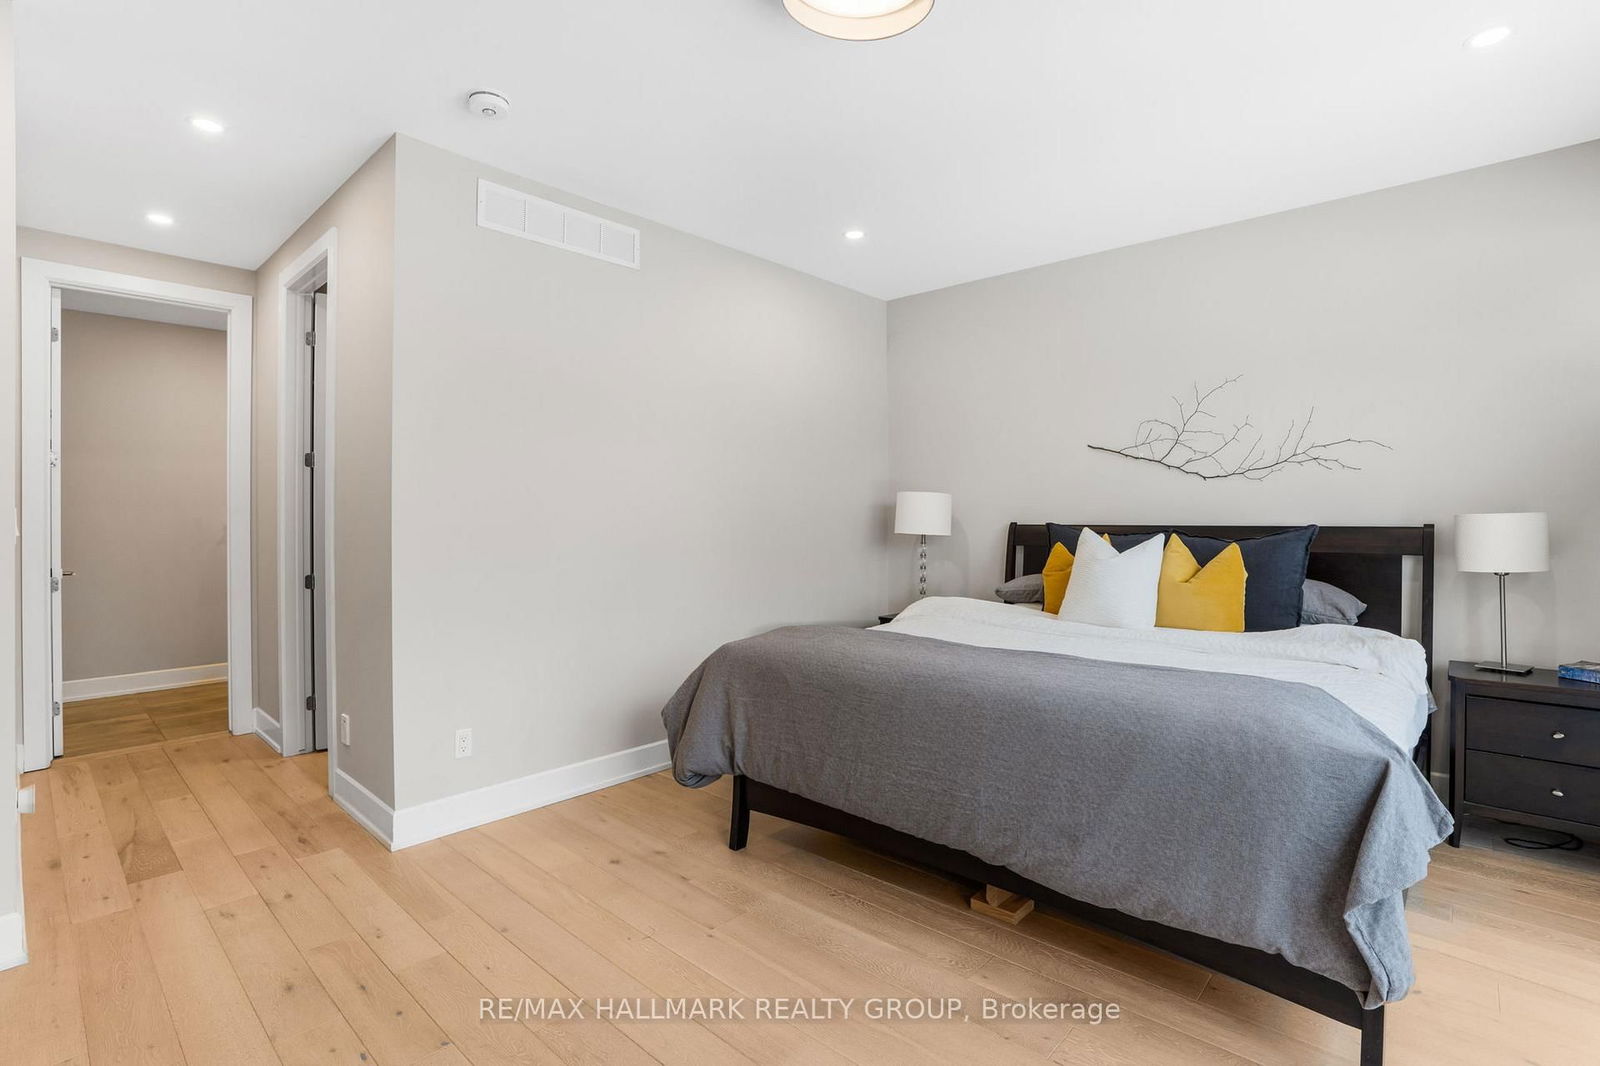
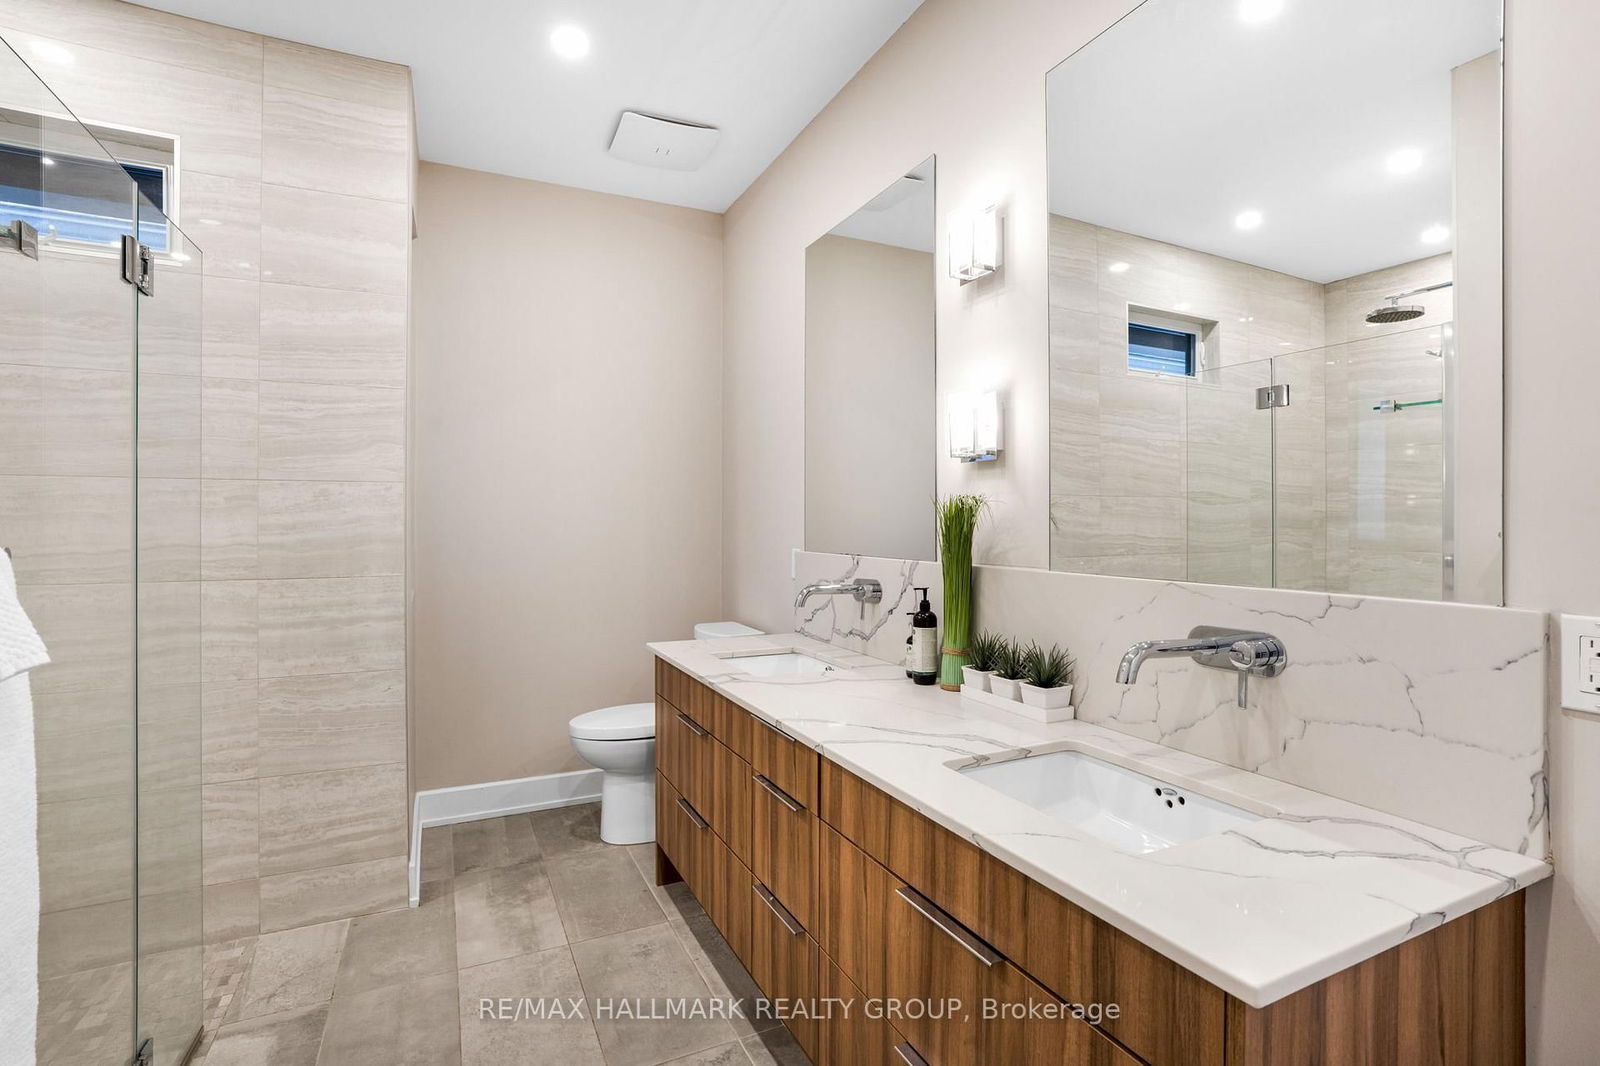
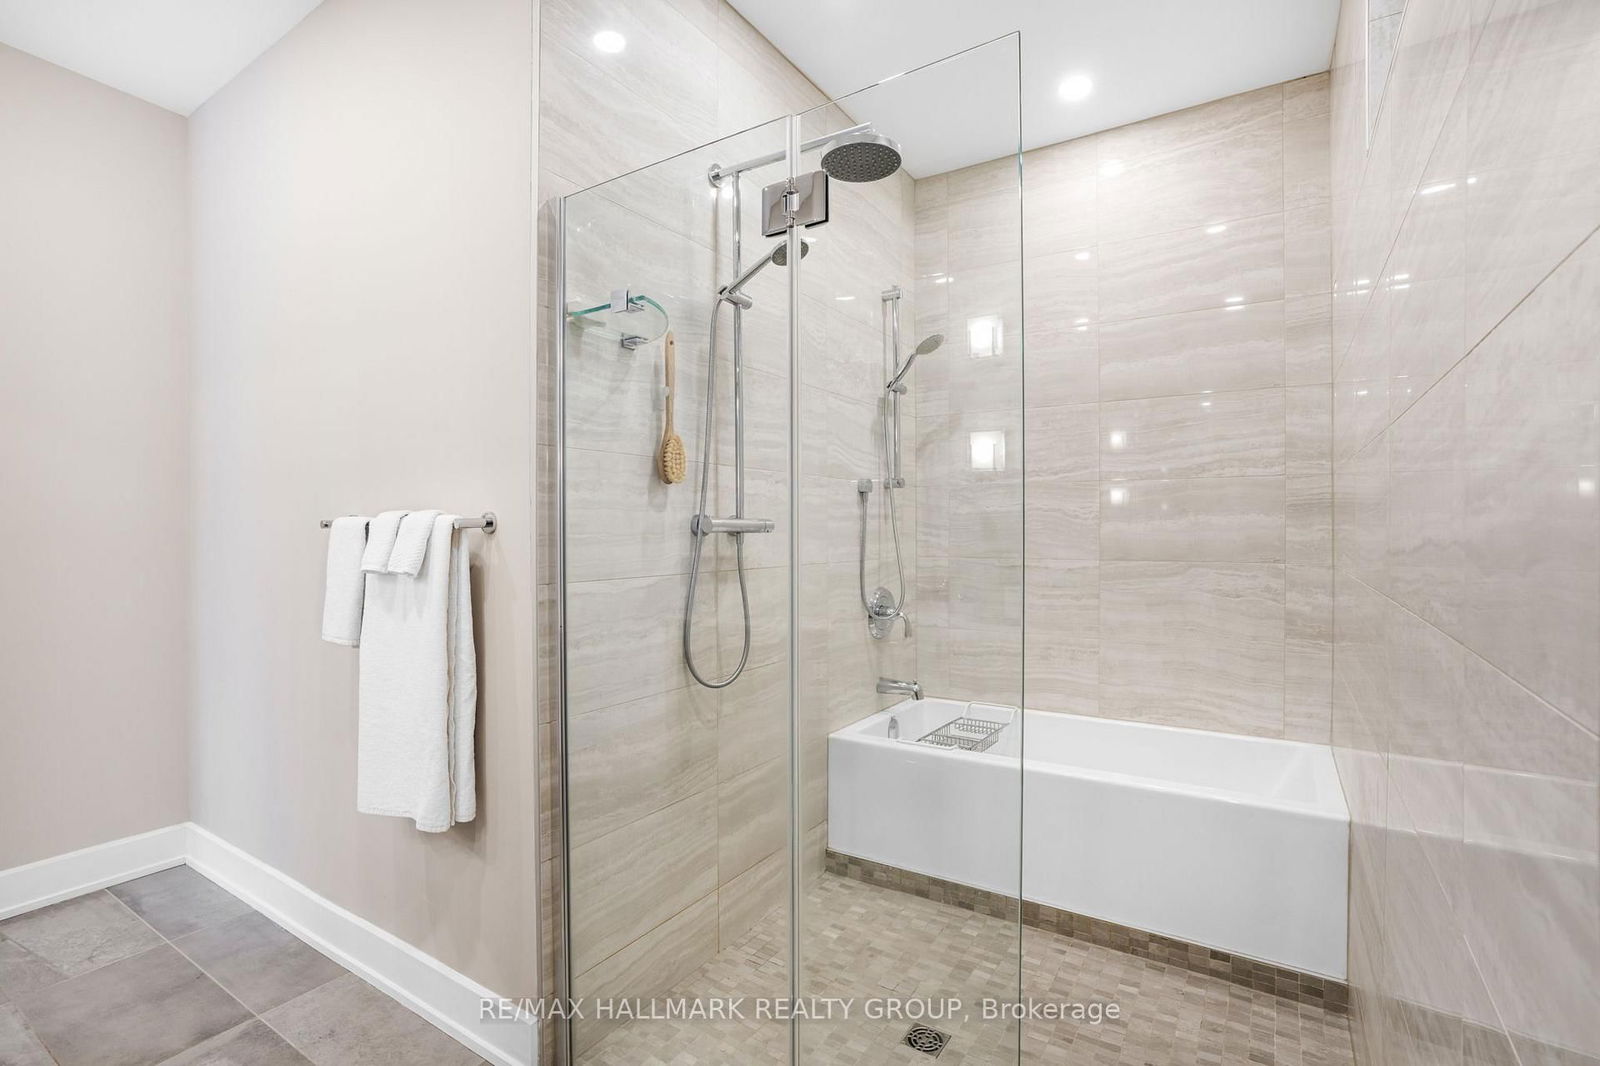
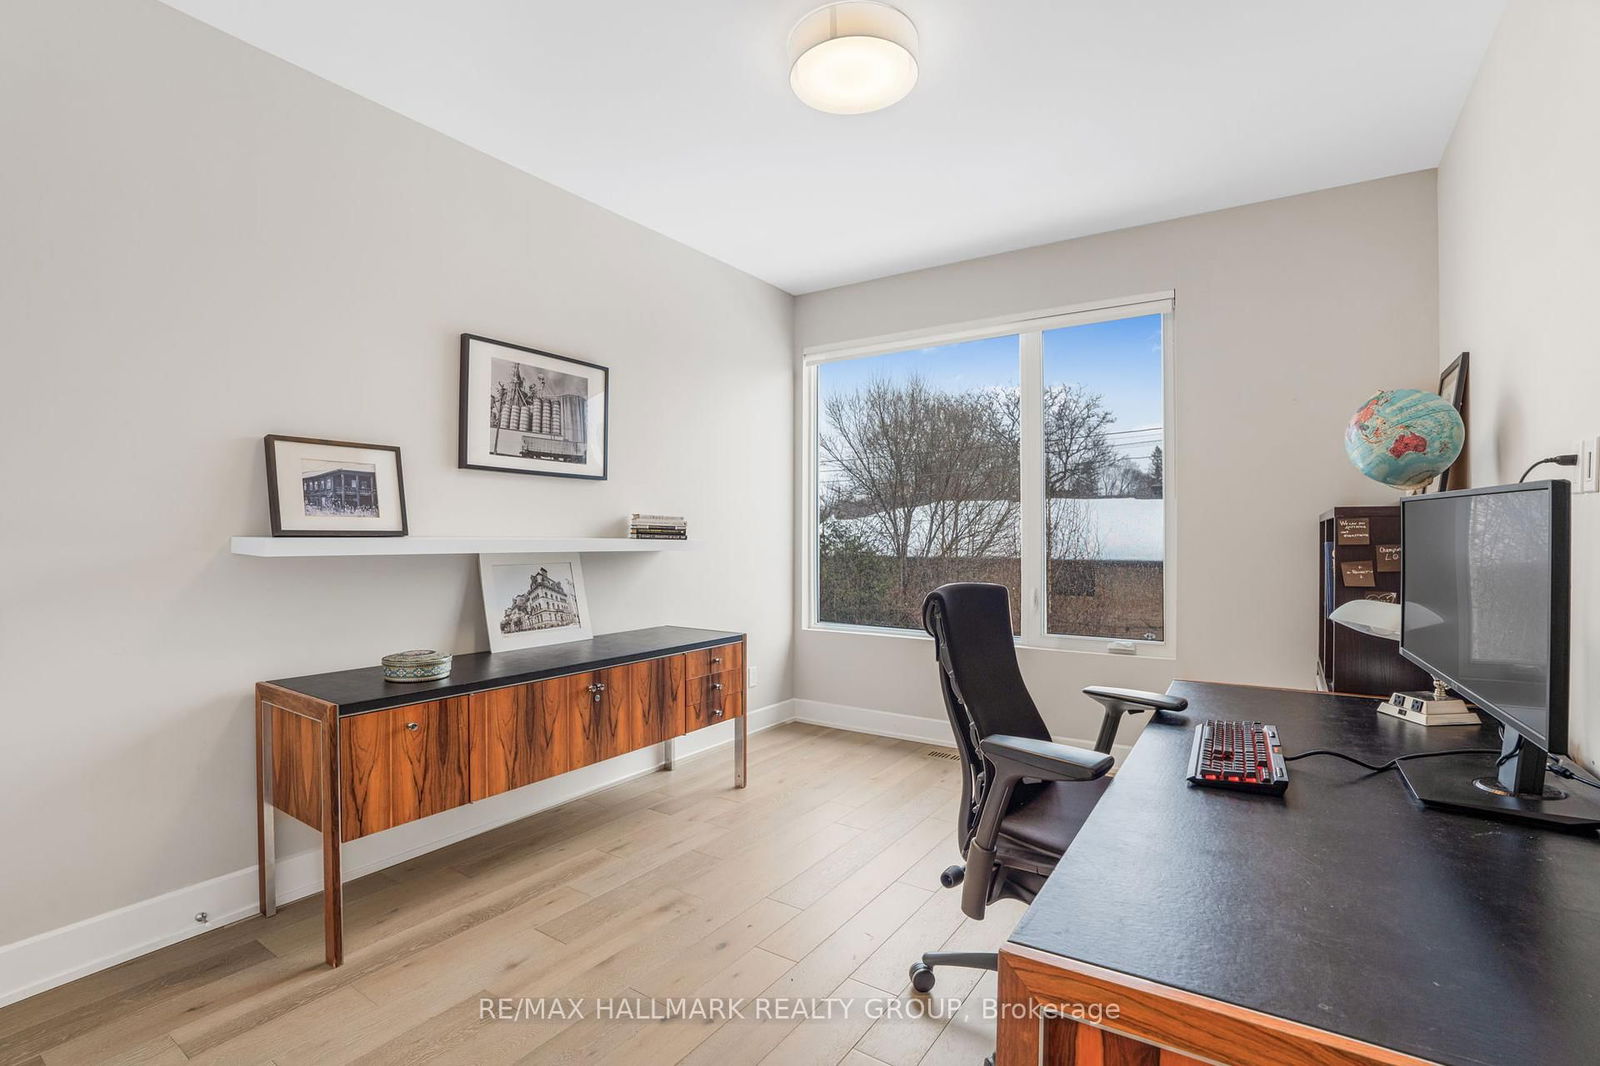
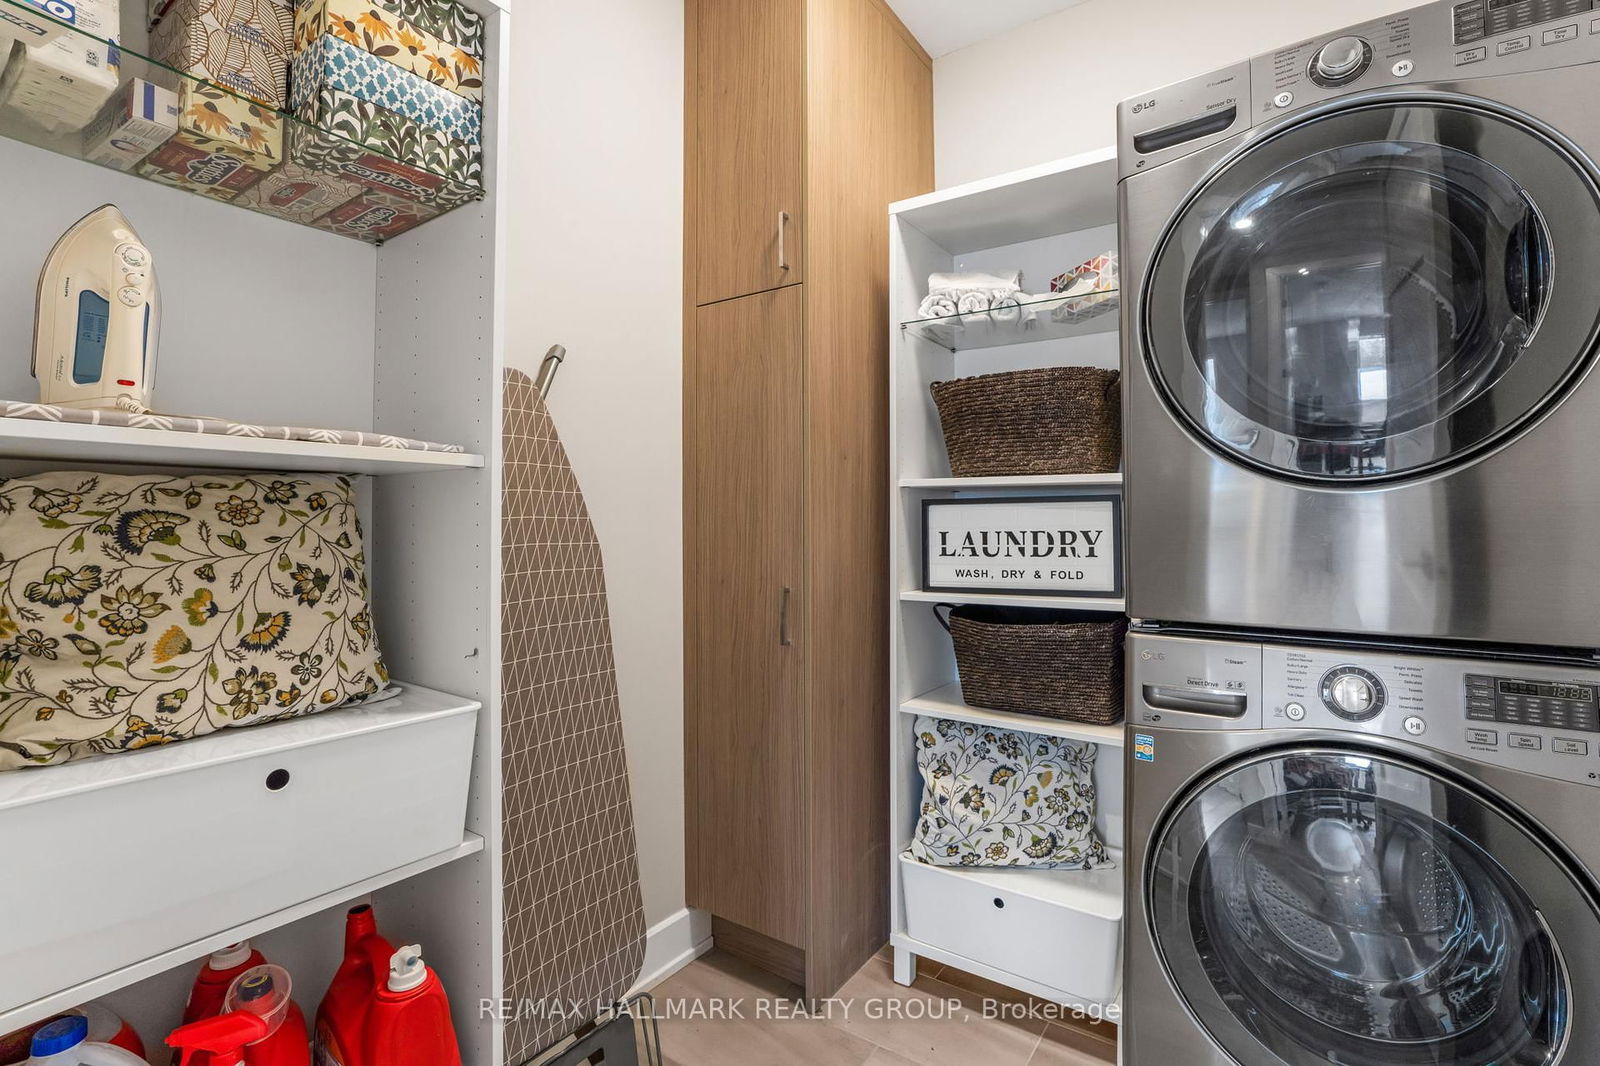
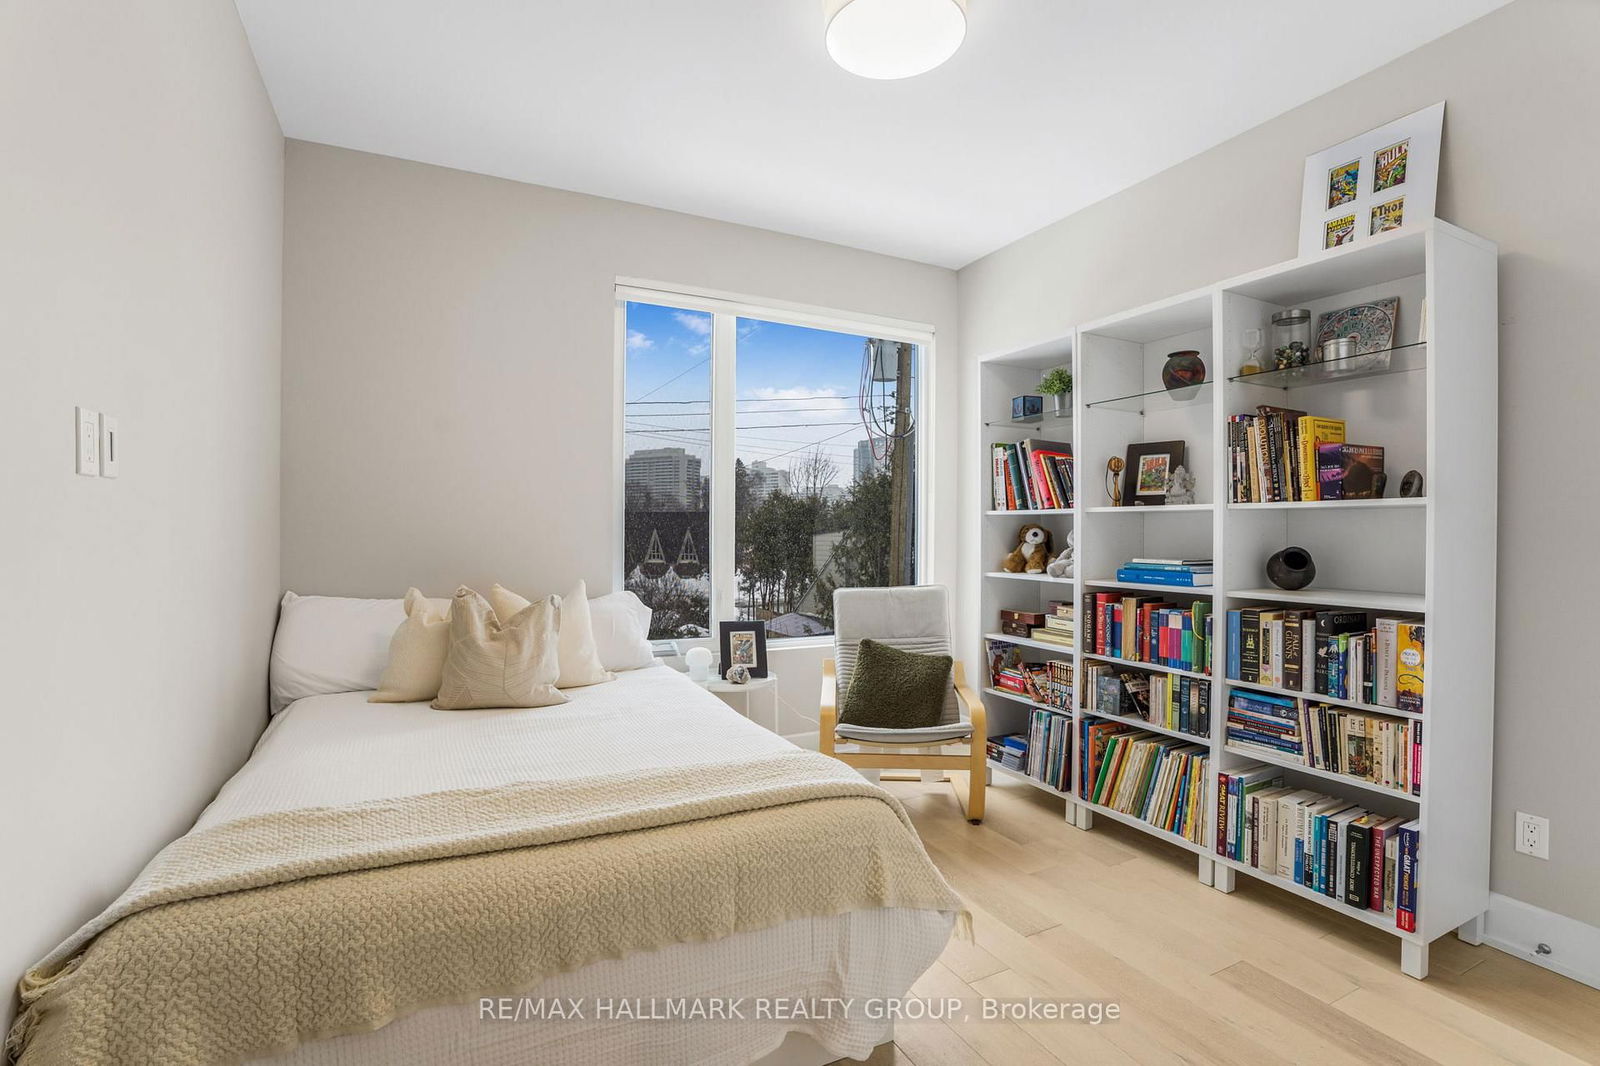
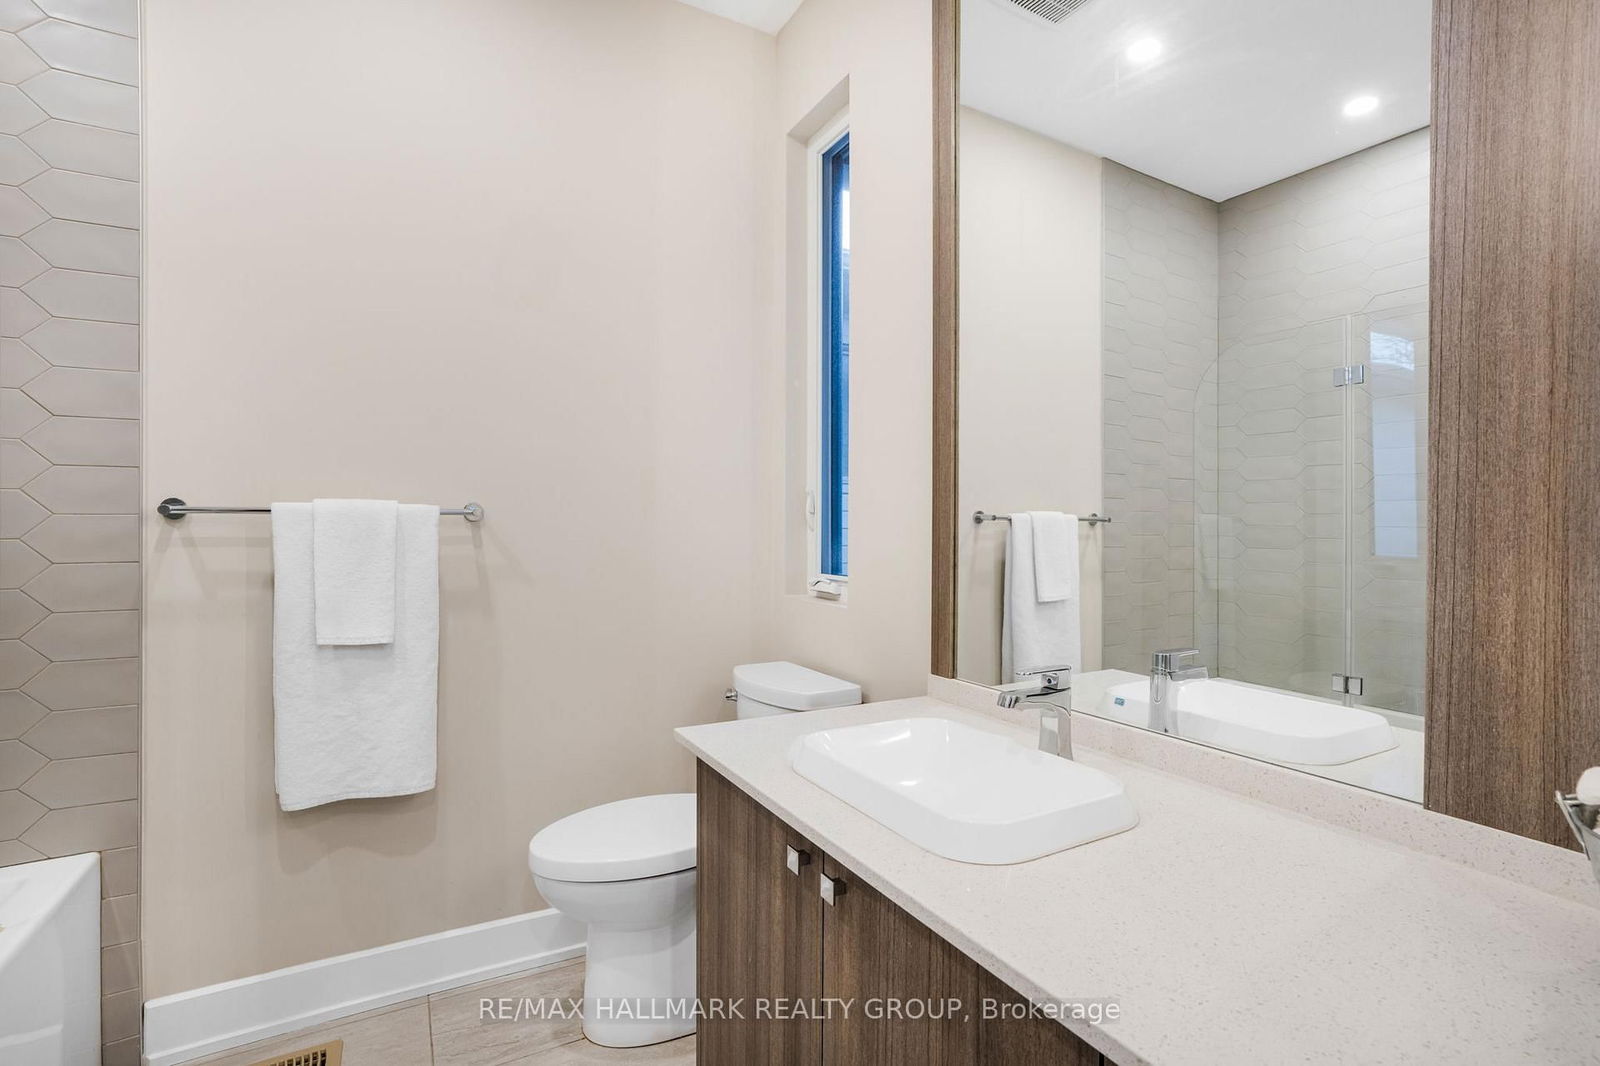
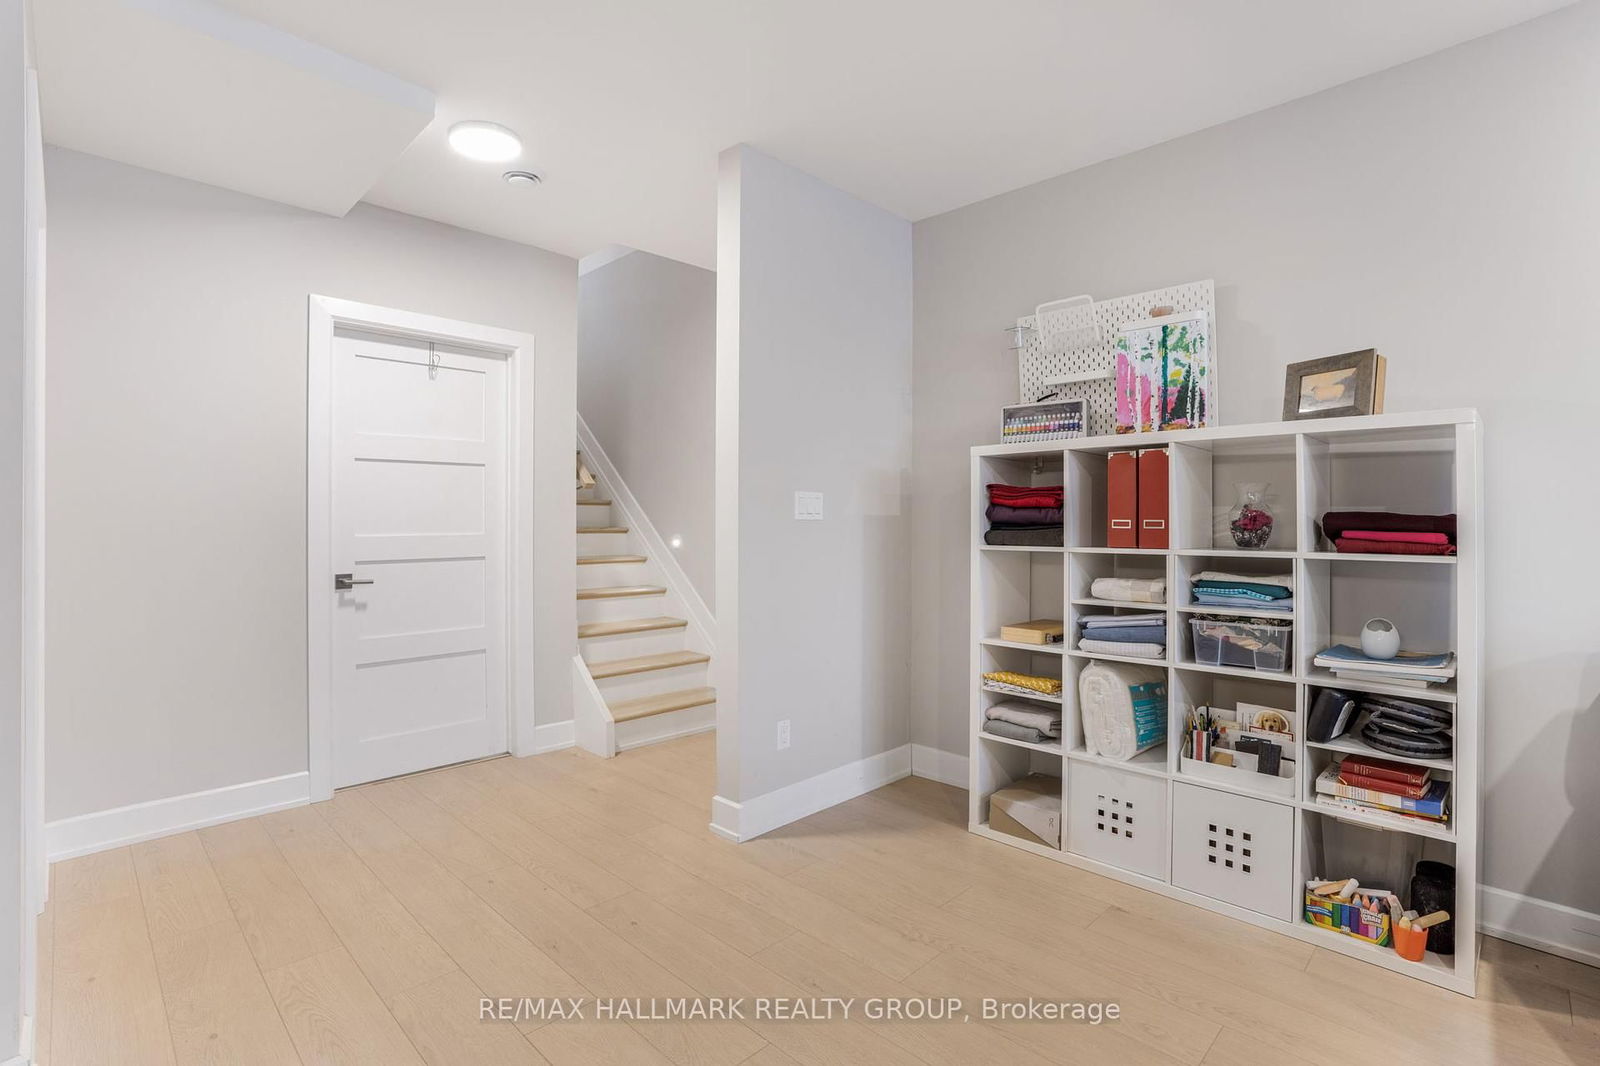
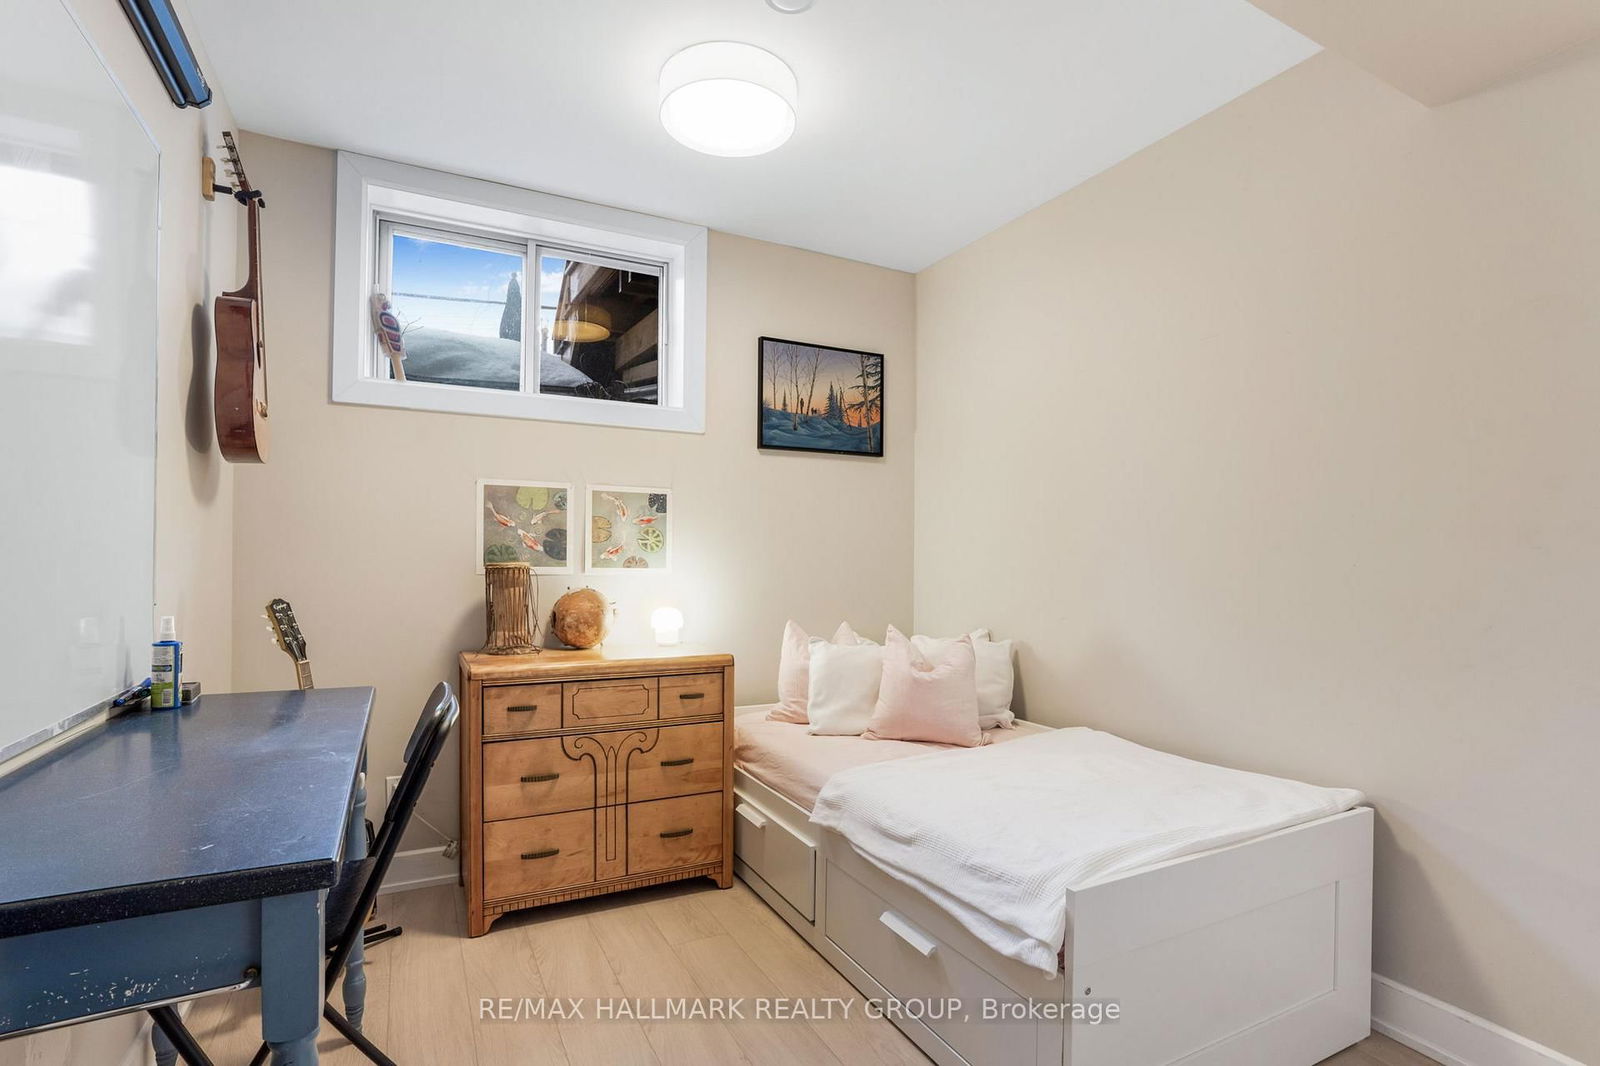
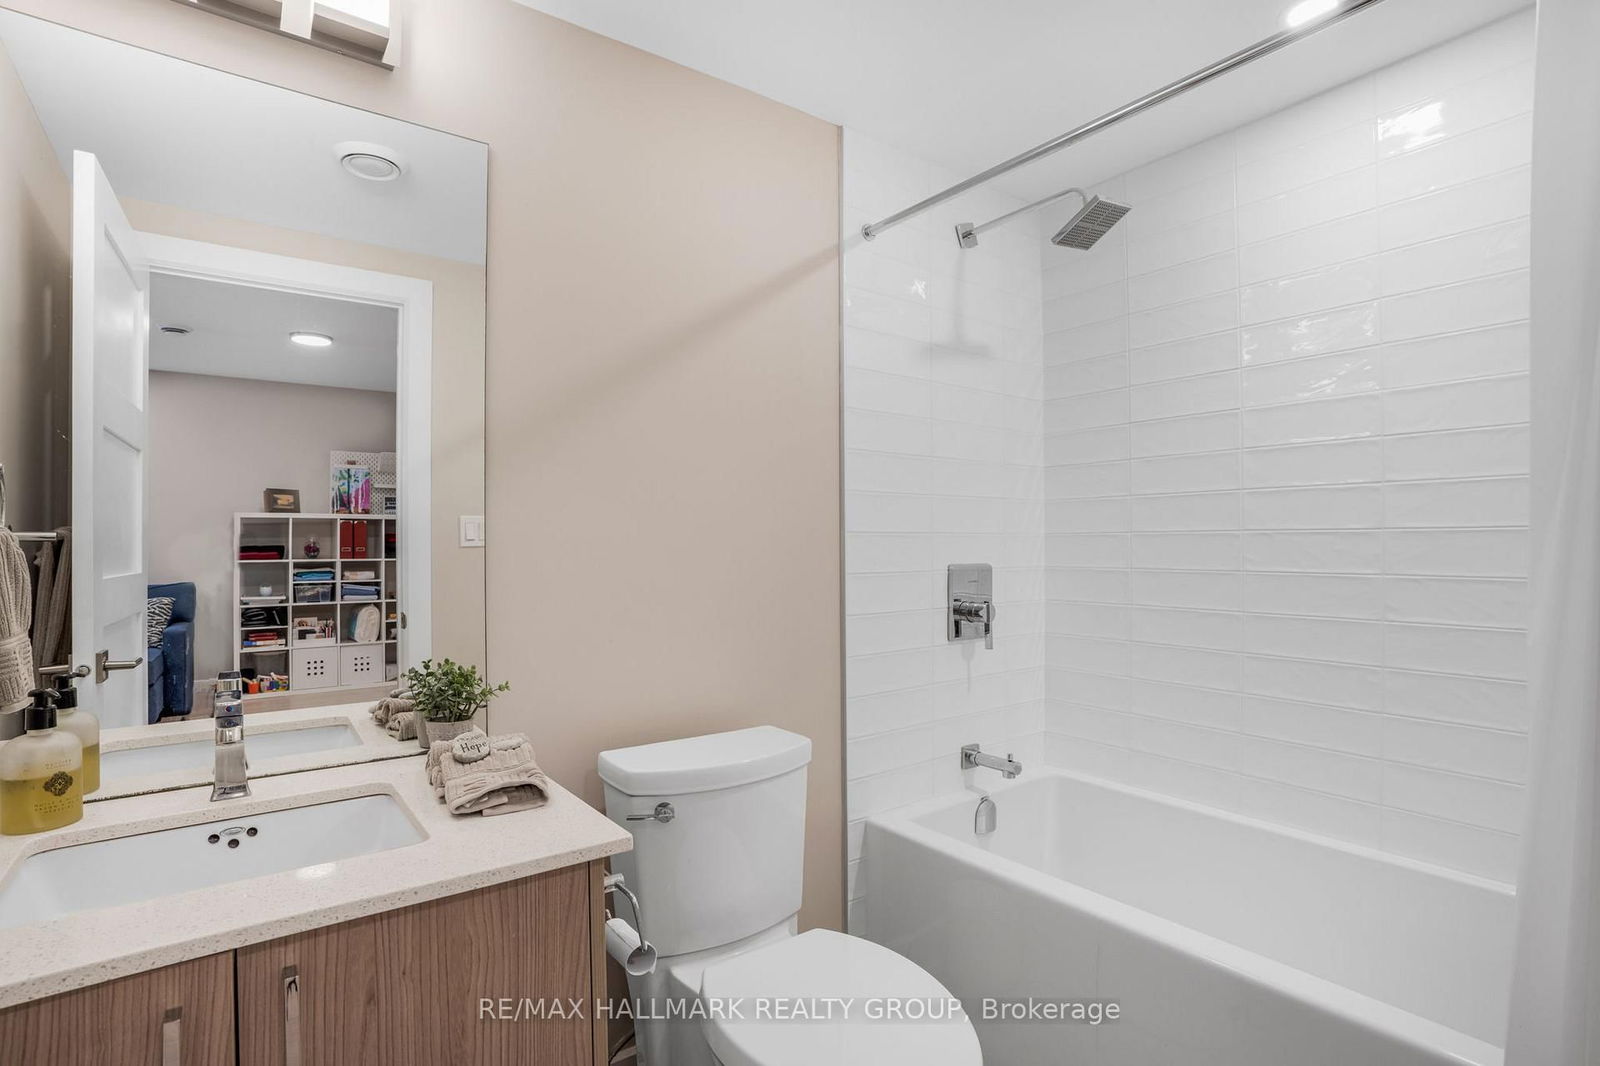
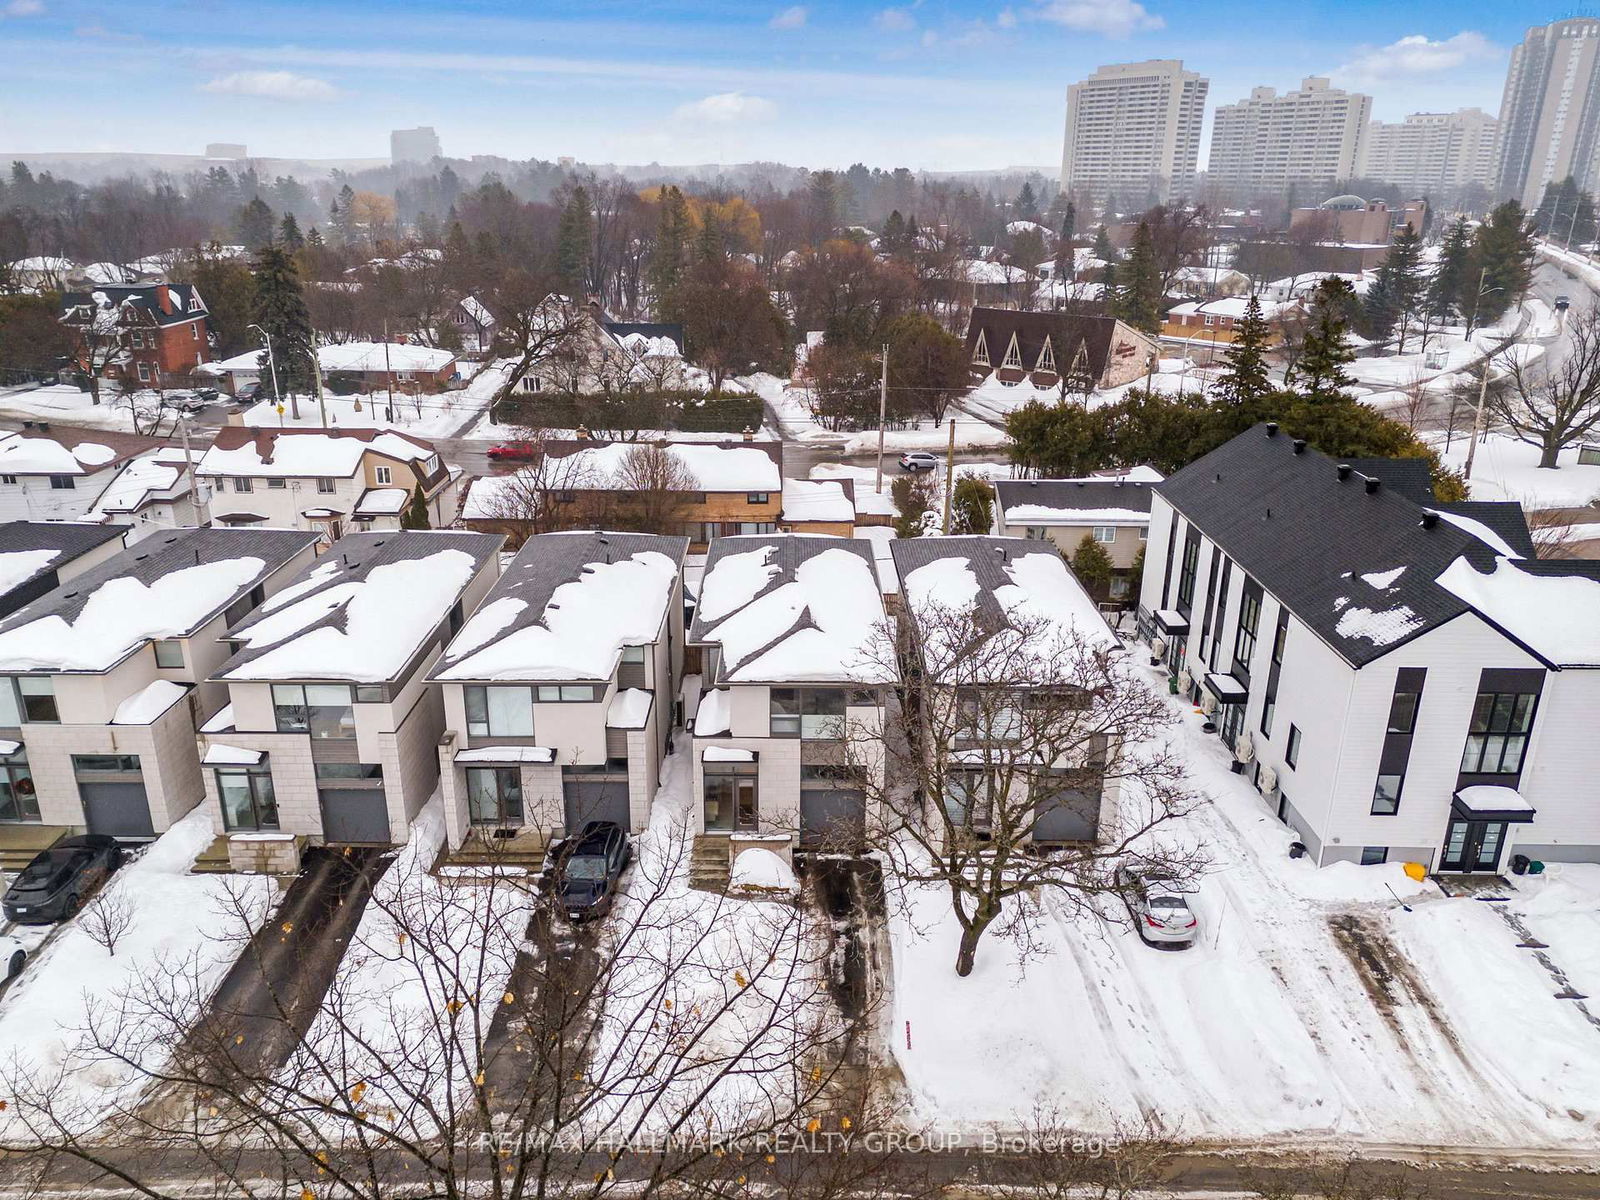
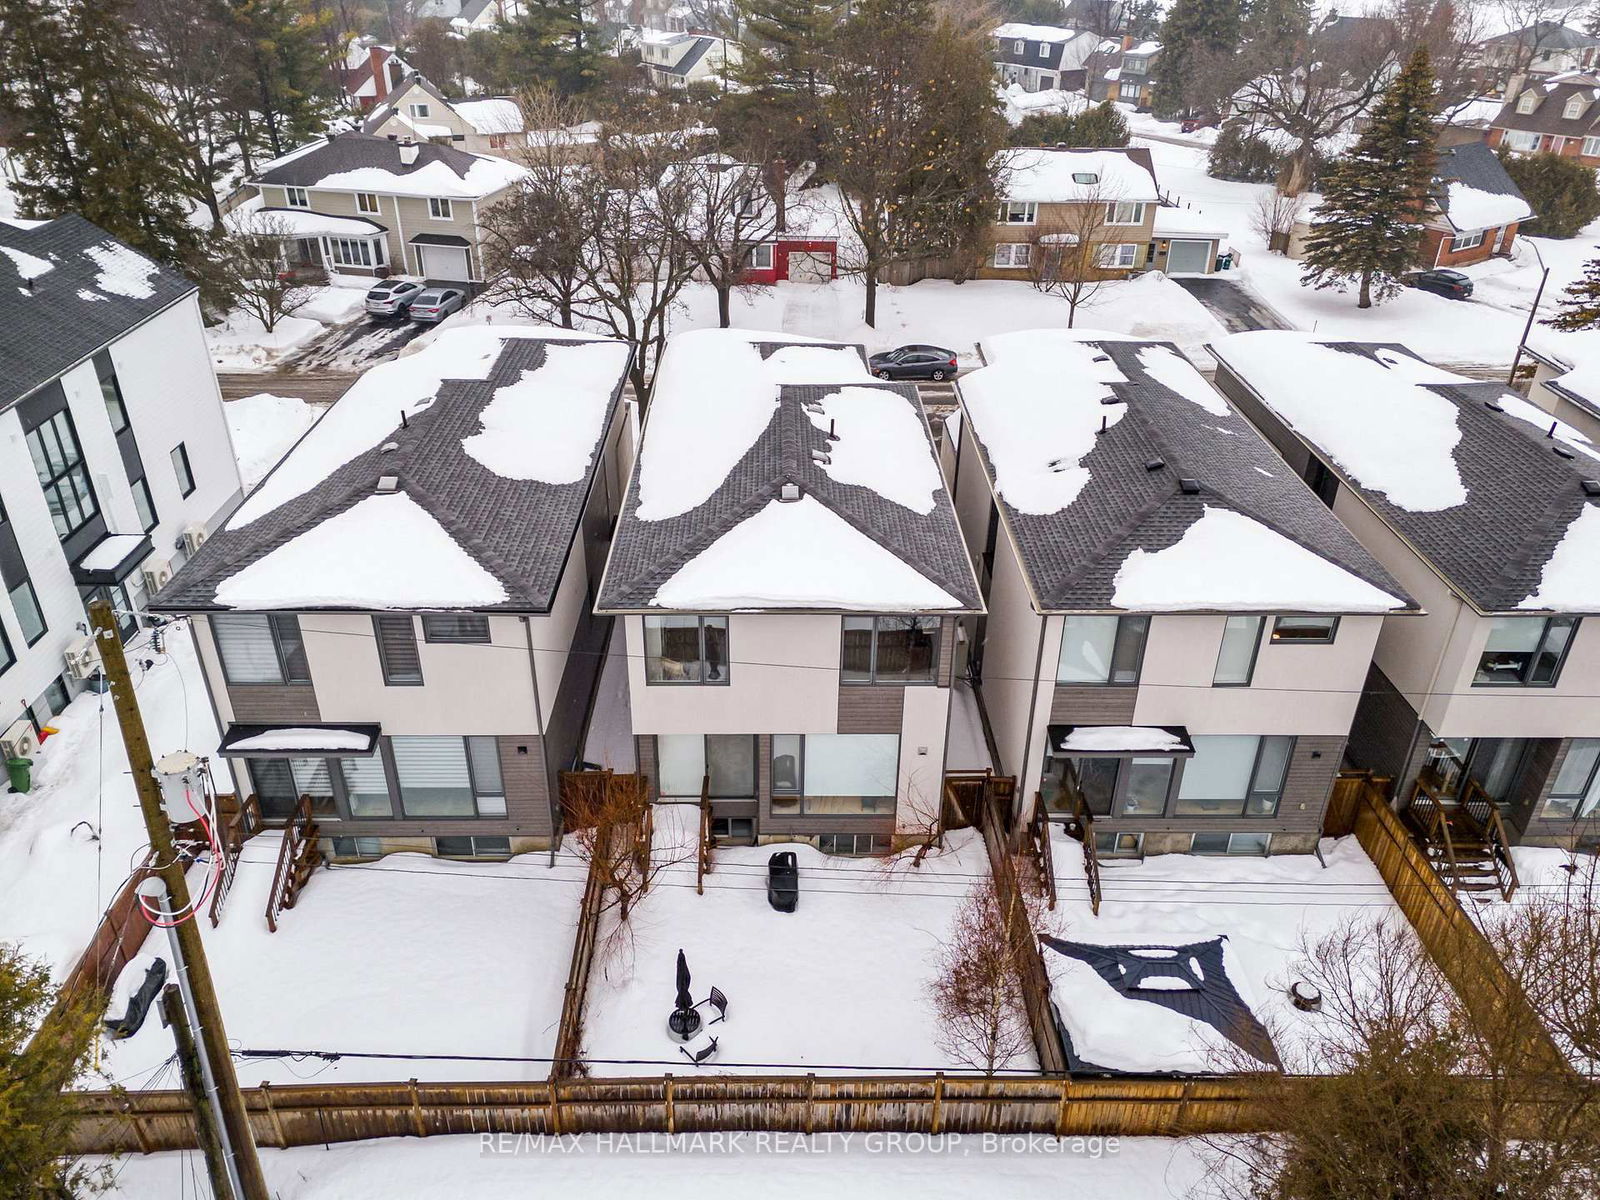
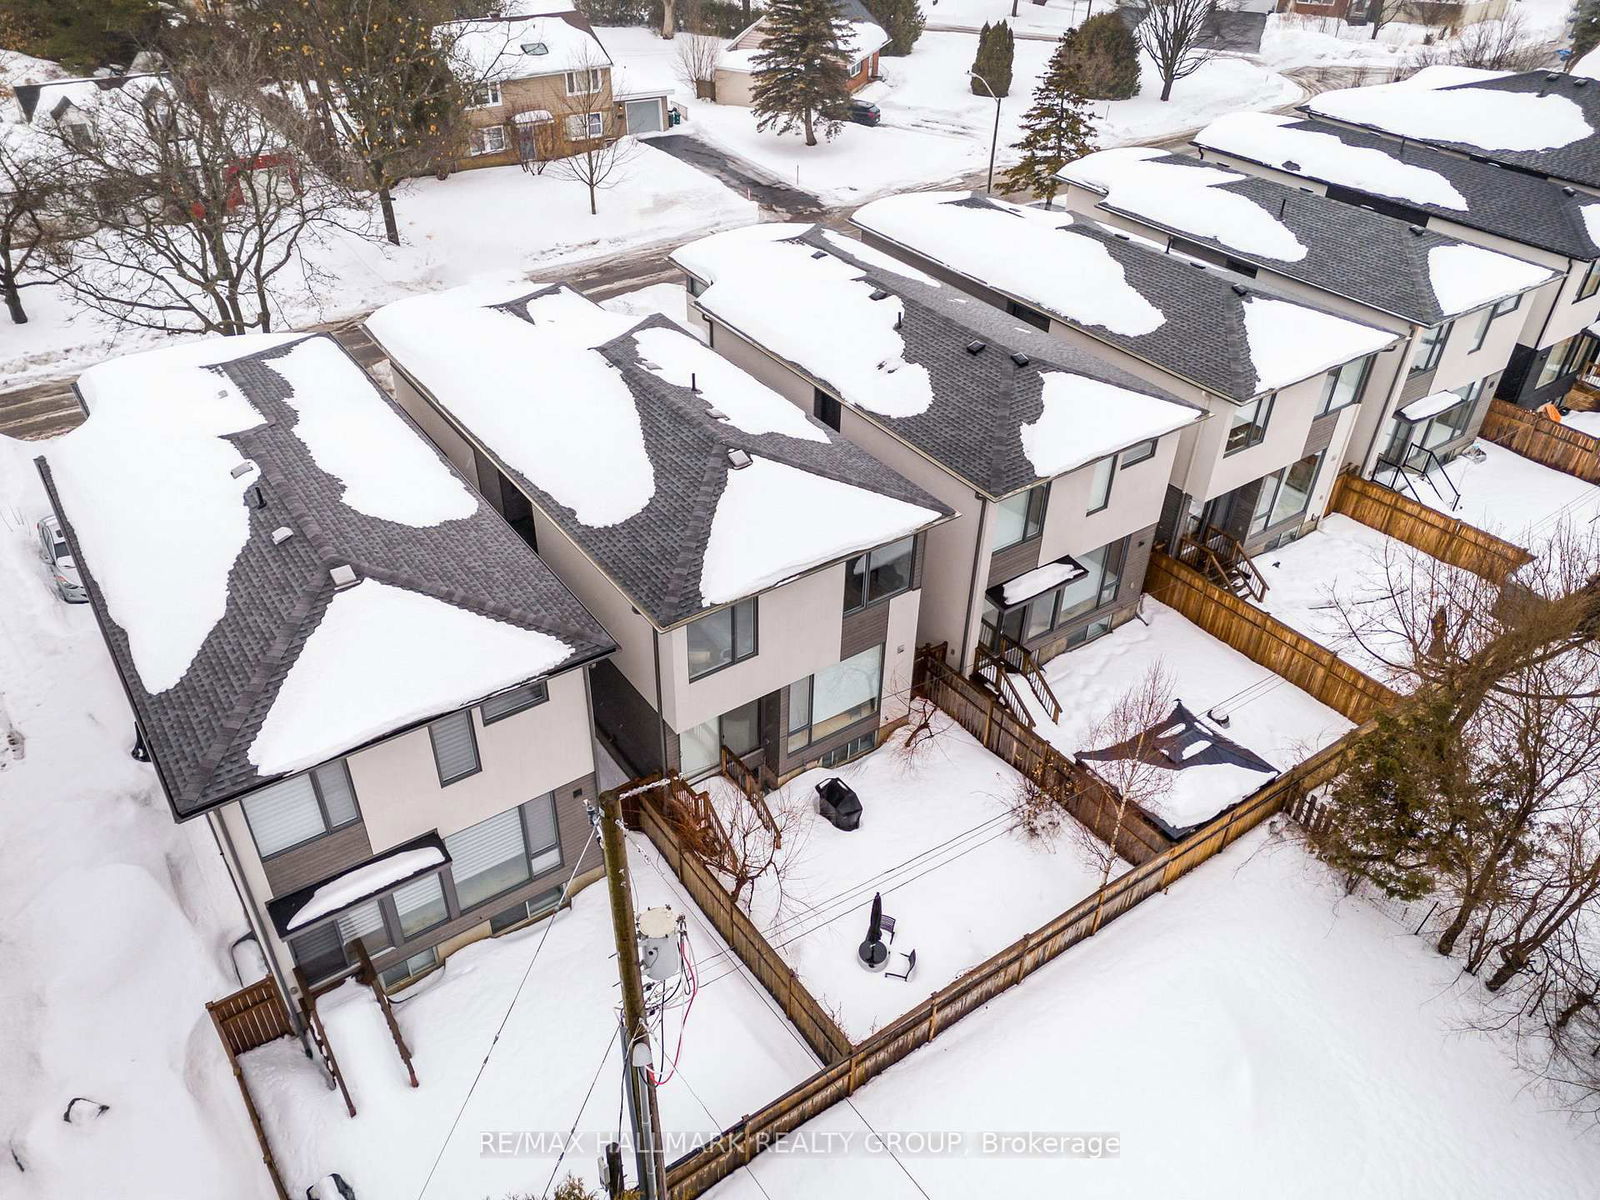
This exceptional residence built in 2018 was designed by the award winning Colizza Bruni Architecture Inc., offering a harmonious blend of modern aesthetics and functional design. Situated in the tranquil Courtland Park neighborhood, the home features a stone and stucco façade with oversized windows (floor to ceiling), ensuring abundant natural light throughout. The interior boasts an open-concept layout with 9-foot ceilings on all levels, including the basement, and hardwood floors throughout. The Foyer has a striking 11 foot ceiling. The gourmet kitchen is equipped with granite countertops, custom cabinetry, and high-end fixtures. Additional highlights include a private side entrance to the basement making it easy to create an in-law suite, a spacious laundry room on the second level, and a yard fully fenced for privacy.This home exemplifies luxury living in a prime location. Lower level equipped with in-floor radiant heating. This is a large spacious home with 4 bedrooms, 3.5 bathrooms with a fully finished basement making all 3 levels livable.The second level offers plenty of windows and light, which is a theme throughout. All bedrooms are a good size and the primary room has a large 4pc ensuite as well as a large walk in closet. Located across from the Experimental Farm, residents can enjoy proximity to Ottawa's best green spaces and parks, including Mooney's Bay, Hog's Back, Vincent Massey Park, Rideau Canal, and Rideau River. We look forward to your visit!
Fridge, Stove, Hood Fan, Dishwasher, Washer, Dryer, Hot Water Tank,
Foyer
Mudroom
Powder Rm
Kitchen
Dining
Living
Primary
Other
null
Laundry
Bathroom
2nd Br
3rd Br
Family
4th Br
Bathroom
Utility
Other
The graph below compares the average list price and average sale price of homes in this neighborhood by month for the last 24 months. When average sale price is greater than average list price, this may suggest a buyer's market. When average sale price is lower than the average list price this may suggest a seller's market.
The graph below illustrates the average days on market for homes in this neighborhood. The yellow area may indicate a buyer's market, the green area may indicate a balanced market and the red area may indicate a seller's market.
Sales Representative, Century 21 People’s Choice Realty Inc., Brokerage
(647) 576 - 2100